
Rethinking Biotech Valuation
Why traditional models fail and how evidence-driven frameworks are reshaping R&D value
Ignacio Sancho-Martinez, CEO & Managing Partner, INBISTRA
Anabel Perez-Gomez, COO & Managing Partner, INBISTRA
Biotech valuations often misrepresent risk and value by relying on generic probabilities, incomplete evidence and linear assumptions. This article explains why traditional models fall short and outlines emerging evidence-driven frameworks that better capture scientific uncertainty, translational risk and execution readiness, supporting more realistic and informed investment decisions in early-stage R&D.

Executive summary
Biotech valuation is often framed as a precise discounted cash flow number. Drug development behaves differently: it progresses through binary gates (go, stop, redesign), uncertainty resolves in jumps, and timing is constrained by patents, competition, and payer policy. These features break the assumptions behind many single-line valuation models.
An evidence-driven framework improves robustness by:
(i) building commercial value (S0) as an auditable, glass-box model
(ii) treating probability of success (PoS) as a prior that updates with evidence
(iii) pricing finite horizons via a cost of waiting
(iv) valuing flexibility with real options, and
(v) separating programme value from platform option value to avoid double counting. The objective is decision support, not false precision.
When the model looks certain, but reality is not
In many biotech boardrooms, valuation discussions still focus on net present value (NPV), a calculation of what a drug’s potential future profits are worth today. On a slide, this number often looks stable and predictable. Then reality arrives. A competitor publishes earlier. A regulator asks for a different endpoint. A payer signals that access will require comparative data. A manufacturing lead time extends the timeline by a year.
None of these events look dramatic in a spreadsheet, yet their combined impact is significant: the addressable population can narrow, net pricing can tighten, and the effective exclusivity window can shrink. In those moments, valuation stops being an accounting exercise and becomes what it always should have been: a tool for linking evidence and decisions to cashflows.
The core problem is that traditional financial tools were designed for stable commercial businesses, assuming continuity, incremental control, stable probabilities and most importantly, revenues. R&D operates through gates, discontinuities, and learning and for early-stage biotech commercial revenue is decades away if at all ever reached. A useful biotech valuation therefore needs to answer three practical questions:
1. What evidence supports the current value?
2. What evidence could significantly change that value?
3. Which decisions protect value or create new value as uncertainty resolves?
Why NPV still dominates biotech conversations
The method used to calculate NPV, known as discounted cash flow, remains the standard language of capital markets. It supports quick screening and it can anchor negotiations. For mature products, it is often sufficient. For R&D, it is often overextended. Classic NPV is treated as a risk model, a strategy model, and a governance tool at the same time even when commercial revenue is not guaranteed. Indeed, in drug discovery the average success of a drug reaching the market starting from Phase I clinical trials still hovers around 8-12 per cent. When a single number is, therefore, asked to represent biology, regulation, operations, and access, the model becomes unreliable and loses its connection to reality.
A smoother way forward does not reject NPV. It reframes it as a baseline within a broader framework that makes risk, evidence and optionality explicit.
Where traditional models break in biotech
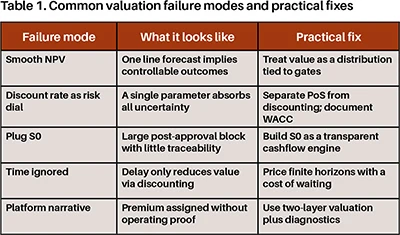
The failures that appear in biotech valuations are remarkably consistent:
1) Continuity assumed in a discontinuous process
NPV implies continuity. Drug development is discontinuous. Programmes advance through a series of gates: target validation, first-in-human, proof-of-concept, pivotal trials, and regulatory review. At each gate, outcomes are often binary or near-binary. A single readout can collapse an indication strategy; a biomarker signal can expand it. Smooth curves hide that asymmetry: downside arrives early and fast, while the upside only arrives late and after overcoming several costly hurdles.
2) Programme risk hidden inside the discount rate
Teams often raise the discount rate to make a model “conservative”. The intention is reasonable, but the mechanism creates a conceptual problem.
The discount rate is designed to reflect the cost of capital and systematic risk. Programme-specific uncertainty is different: it depends on how the project is designed and executed. Its main drivers are probability of success (PoS) assumptions, development timelines, manufacturing feasibility, access evidence, and operational execution. When that uncertainty is absorbed into a single discount rate, the model loses transparency. It becomes hard to audit and harder to improve.
3) S0 treated as a plug, not a commercial engine
Many biotech models place most value into a single post-approval block, often labelled S0. When S0 becomes a plug, a single assumed number, value becomes difficult to defend. Commercial value is operational, not abstract. It includes who gets treated, when they get treated, at what net price, and for how long exclusivity holds. Patient segmentation, uptake dynamics, geography sequencing, and loss of exclusivity are the primary drivers of cash-flow generation.
4) Time treated as discounting rather than strategy
Discounting captures the time value of money. It does not capture deadlines. Time in biotech is strategic.
Patents impose boundaries. Competitors convert time into market share. Payers convert time into policy. Manufacturing lead times impose constraints. Delays can compress the effective exclusivity window and change the competitive set. If a model cannot price the economic penalty of delay, it risks rewarding recommending deferral even when deferral destroys value.
5) Platform premiums assigned without proof
Platforms can earn a premium when they demonstrate repeatability. Claims of faster cycles, more programmes, or better outcomes only matter when supported by observable results.
Without operating telemetry, platform valuation becomes narrative-driven and fragile. When the market demands proof, assumed platform value can disappear quickly. (Figure 1) (Table 1)
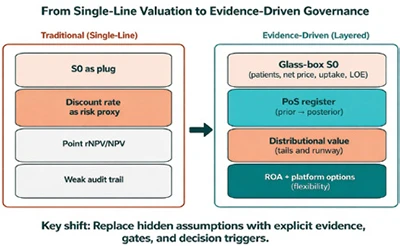
Figure 1. From single-line valuation to evidence-driven governance. Side-by-side comparison showing a typical single-line approach (S0 plug, discount rate used as a proxy for risk, point estimate) versus a layered evidence-driven framework (glass-box S0, PoS register with prior posterior updates, distributional value and runway risk, and real options/platform options).
rNPV remains the baseline, but it should not be the finish line
Risk-adjusted NPV (rNPV) improves on classic NPV by applying explicit PoS to future cashflows. It matches the staged nature of development, and it aligns naturally with milestone-based deal structures. As a baseline, rNPV forces uncertainty into the open and it prevents the discount rate from becoming a substitute for science. At the same time, rNPV has predictable blind spots. It often collapses uncertainty into a single number. It often treats PoS as static even though PoS should evolve with evidence and trial design. Furthermore, PoS values are typically generic, based on therapeutic area or global modality. Thus, ignoring the reality and design of a given individual project or technology. rNPV also assigns no direct value to flexibility, despite the fact that staged decision-making is the core operating advantage of biotech.
A simple test captures the gap. If an upcoming readout could lead to acceleration, redesign, partnering, or abandonment, then value depends on those choices. A model that cannot represent those choices is incomplete for decision-making.
A Phase I asset can show a negative rNPV even with a large commercial prize because long timelines, high costs, and low cumulative PoS dominate the expected value. After de-risking, the same asset can move sharply upward without any change in peak sales assumptions. That change reflects the accumulation of supporting evidence.
An evidence-driven, four-layer valuation framework
Evidence-driven valuation does not replace rNPV. It builds on it by structuring assumptions in a way that mirrors how decisions are made.
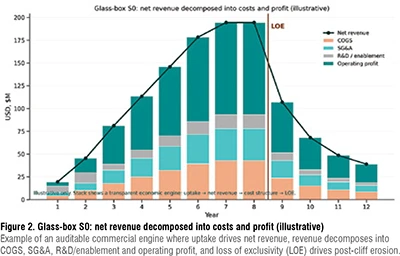
1) Build S0 as a glass-box
S0 represents the present value of post-launch cashflows, conditional on success. In a robust valuation, S0 is not a terminal assumption, but as an auditable commercial model. A glass-box S0 explicitly models patient segmentation, net price corridors (list to net), adoption ramps, geography sequencing, and loss-of-exclusivity erosion. This level of transparency shifts attention from arguing about peak sales to specifying the evidence required to achieve access and uptake.
At this point, valuation connects directly to strategy. Access evidence often drives value more than statistical significance alone. For example, a trial that changes guideline placement can change uptake, or biomarker strategies can change payer restrictions and net pricing. When those links are explicit, valuation becomes a shared operating model rather than a negotiation artefact. Geography also becomes a first-order driver. Launch sequencing, regulatory and access lags, and channel-specific net pricing can change present value materially. A credible SO therefore includes realistic net price corridors by market, timing assumptions for availability, and an explicit view of loss of exclusivity. Without that structure, models tend to overvalue later years and underestimate how timing and access shape the first years after launch. (Figure 2)
2) Treat PoS as a prior that updates with evidence
Most valuation disagreements are PoS disagreements.
Benchmarks provide a defensible starting point and show large differences by therapeutic area and phase. Yet PoS should not remain static. It should evolve as evidence accumulates, and those updates should be transparent. An evidence-driven approach treats PoS as a prior that updates with evidence. Each update should be explainable: which data moved confidence, why it moved, and what could move it again. Evidence that commonly drives updates includes mechanistic coherence (target, biomarker, and patient selection), effect size versus a clinically meaningful threshold, safety margin, manufacturability, and external validation through competitive readouts and regulatory precedent.
3) Price time and risk explicitly
Option theory highlights a counterintuitive result: uncertainty can make waiting valuable. In biotech, waiting is rarely free. Patents impose boundaries, competitors advance, payers revise policy, and manufacturing lead times constrain timing. Delays can compress the effective exclusivity window and alter the competitive landscape.
An evidence-driven valuation introduces a cost of waiting that represents the economic penalty of delay beyond standard discounting. This cost can be informed by remaining exclusivity, expected competitive entry, and access erosion. Framing time this way makes a key governance decision measurable: whether delay preserves value through learning or destroys value through lost time.
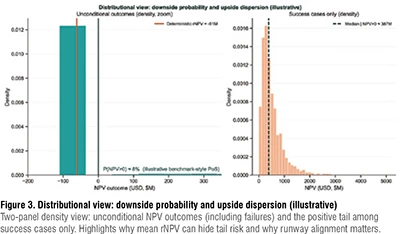
A single rNPV hides tail risk. Distributional valuation, for example via Monte Carlo simulation around timelines, PoS, and commercial assumptions, shows how often outcomes are negative even when the mean is positive. It also links value to runway needs, which is critical when capital must last until catalysts rather than arriving continuously. (Figure 3)
4) Value flexibility with real options and separate platform value
Real Options Analysis (ROA) values the right, not the obligation, to invest as uncertainty resolves. That framing matches clinical development. ROA becomes most useful when flexibility is large relative to the baseline rNPV. For example, informative early readouts can justify deferral, credible expansion paths can justify paying for optionality, or strong abandonment value can justify more shots on goal because downside is capped.
Platforms require an additional step. Platform value reflects a measurable capacity to generate additional programmes and to improve early-stage conversion. Valuation therefore benefits from a two-layer approach:
Layer A: Value specific development programmes using rNPV (and ROA where relevant).
Layer B: Value platform option capacity, grounded in operating evidence and net of obsolescence risk, without double counting value already captured in Layer A. (Table 2)
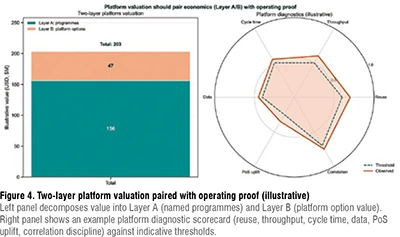
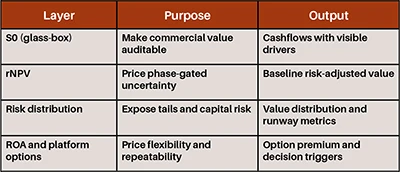
Table 2. Evidence-driven valuation stack (from auditable economics to decision value)
What changes when valuation becomes evidence-driven
When valuation becomes evidence-driven, it stops being a static output and becomes a working tool, changing how teams prioritise and decide. Three practical elements make this operational:
1) Evidence register: a simple list of the main assumptions behind the valuation (who will be treated, expected prices, probability of success), what evidence currently supports them, and which upcoming results could change them. This helps teams focus discussions on data rather than arguing about discount rates.
2) Decision map: a clear view of the upcoming development steps, what each step is expected to teach, and how much it will cost. This clarifies which gates generate the most learning per euro and which gates should be accelerated or redesigned.
3) Portfolio discipline: a portfolio-level view of risks that affect multiple programmes at the same time, improving sequencing and capital allocation.
Together, the three elements make valuation actionable by linking evidence, timing, and the cost of delay to decisions. In practice, evidence-driven valuation supports capital efficiency, because it rewards informative milestones, not only ambitious ones.
Conclusion
Traditional valuation models fail in biotech because they assume continuity where R&D is discontinuous, and they hide evidence behind aggregate parameters. rNPV remains an essential baseline, but robust valuation requires additional layers: an auditable S0, evidence-updated PoS, distributional risk, explicit finite-horizon timing, and flexibility value via real options.
For platform companies, a two-layer architecture prevents narrative premiums from overwhelming programme economics. The output is not only a better number. It is a valuation framework that can survive reality and improve R&D decisions.
References:
1. Hay M, Thomas DW, Craighead JL, Economides C, Rosenthal J. Clinical development success rates for investigational drugs. Nat Biotechnol. 2014;32(1):40–51. https://doi.org/10.1038/nbt.2786
2. Wong CH, Siah KW, Lo AW. Estimation of clinical trial success rates and related parameters. Biostatistics. 2019;20(2):273–286. https://doi.org/10.1093/biostatistics/kxx069
3. DiMasi JA, Grabowski HG, Hansen RW. Innovation in the pharmaceutical industry: New estimates of R&D costs. J Health Econ. 2016;47:20–33. https://doi.org/10.1016/j.jhealeco.2016.01.012
4. Paul SM, Mytelka DS, Dunwiddie CT, et al. How to improve R&D productivity: the pharmaceutical industry’s grand challenge. Nat Rev Drug Discov. 2010;9(3):203–214. https://doi.org/10.1038/nrd3078
5. Dixit AK, Pindyck RS. Investment Under Uncertainty. Princeton University Press; 1994.
6. Trigeorgis L. Real Options: Managerial Flexibility and Strategy in Resource Allocation. MIT Press; 1996.
7. Luehrman TA. Investment opportunities as real options: Getting started on the numbers. Harvard Business Review. 1998;76(4):51–67.
8. Amram M, Kulatilaka N. Real Options: Managing Strategic Investment in an Uncertain World. Harvard Business School Press; 1999.
Author Bio

Ignacio Sancho-Martinez, PhD is CEO & Managing Partner at INBISTRA, with 20+ years of international leadership across academia, biotech, and global pharma. He has advanced multiple small-molecule and biologic programs into the clinic, including FDA fast-track assets, built drug discovery organizations from scratch, and led translational strategies across diverse therapeutic areas and modalities.

Anabel Perez-Gomez, PhD, MBA is COO & Managing Partner at INBISTRA, with 20+ years of experience in preclinical development, R&D portfolio optimization, and strategic partnerships across Europe and North America. She has led R&D programs at renowned institutions and built corporate venture initiatives, combining deep scientific expertise with rigorous execution and business-driven decision-making.