Several data tend naturally to show various deviations and significant skewness from normal or other assumed distributions. The query that may be raised is about the extent to which Shewhart charts can be used for data that do not meet such conditions with this regards (I) charts have received some attention.
Introduction
The application of control charts in the monitoring of industrial and manufacturing processes has become an indispensable tool in the modern industry. Special attention can be brought to its application in the healthcare industry. However, obtaining ideal results - to be interpreted - that fit exact conditions for dedicated types of control charts are not feasible and uncommon in most cases. Several data tend naturally to show various shapes of deviations and distributions which may show significant skewness or distortion from normality or other presumed distributions for control chart such as Poisson and negative binomial depending on the type of the trending chart.
The query that may be raised in such circumstances is about the extent to which variable-type Shewhart charts especially Individual-Moving Range (I-MR) control charts can be could for data that do not meet the required conditions. (I) trending charts have received some attention here because there was evidence of their equivalency to Laney-modified attribute charts on important critical parameters in trending charts using a statistical program Minitab® version 17.1.0. These aspects include control limits and some types of the warning alarm signals. There is a debate concerning the use of I-MR chart for non- normal data between the experts of Statistical Process Control (SPC).
The crux is that if I-MR chart could be used for non-normal data directly and gives reasonably valid parameters, then this may solve the dilemma of the searching for a way to transform data to fit the assumed prerequisite distribution for the control chart with various attempts such as justified outlier removal, Box-Cox transformation (W = Yλ), root square and logarithmic (to the base ten) transformation. In some instances, some or all trials of transformation may still yield non-normally distributed data in exhaustive attempts.
Case description
The following case showed practically that the underlying assumption for distribution may be not fulfilled, yet the parameters derived from a two different control charts will still agree. However, this issue should be approached with caution and further investigation as this is a debatable topic. An example for this critical assumption could be illustrated from the following example of passive air sampling data of settle Tryptone Soya Agar (TSA) plates taken for the air of the clean area of the manufacturing facility during periods donated I, II and III during four hours.
Results of microbial enumeration as Colony Forming Unit (CFU) were collected for each time period after standard incubation procedures of agar plates in the incubators for the dedicated time. Statistical analysis of data - using statistical software packages: GraphPad Prism version 6 for Windows and Minitab® 17.1.0 - showed that they did not pass the normality test by Kolmogorov–Smirnov test (K–S test or KS test) nor Shapiro-Wilk normality test at α = 0.5. Deviation from normal distribution pattern can be demonstrated in Figure 1 using box and whisker plot and histogram. Moreover, box plot diagram shows data spreading, skewness and the general trend.
On the other hand, microbiological result pattern of data failed to follow Poisson distribution with the risk of increased false alarm (if any) when conventional attribute process-behavior chart was used which justify using Laney modification on the control charts. Figure 2 and 3 show data trending of microbiological results using I-MR and Laney corrected attribute charts (indicated by Z value for correction of overdispersion or underdispersion), respectively.
By comparing individual chart section with the attribute chart for each time period, the outcome parameters could be found to be the same. However, variable control charts have the advantage of extra alarms sensitivity as it identifies the alarm types that aretwice that of the attribute charts. In addition, the stability of the process variability can be assessed using MR chart which is not present in the corresponding attribute chart. Direct data processing without prior steps for transformation or modification may provide a valuable advantage of time-saving and minimising handling error. In addition, the use of statistical software packages enable the investigator to follow and track the monitored process in real time to control it before any true excursion could occur, if deviation was detected. Finally, an appropriate and thorough analysis should be executed to evaluate the validity of the current principle in the implementation of the trending charts.
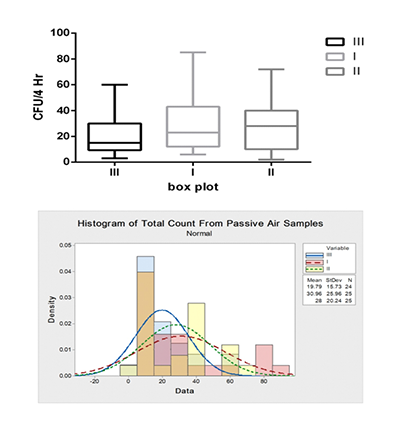
Figure 1. Distribution pattern and the deviation from the bell-shaped sample population expressed as box and whisker diagram (upper graph) and histogram (lower graph)
According to the control charts in Figure 2 and 3, the process is stable with no out-of-control points and the variability between successive readings is stable MR chart in Figure 2). In the present case, there is an Upper Control Limit (UCL) only as the microbiological limit is one-sided. While there is no need for Lower Control Limit (LCL) as values approaching ‘zero’ or equal to ‘zero’ are normally desirable. Nevertheless, UCL should not exceed the maximum CFU count criterion which is called upper specification limit (USL). Actually, as UCL is getting far below the USL, the confidence in the process being in-control increases. In such instances, the process should be checked with the applied USL to determine the degree of the compliance to the desired inspection characteristic.
Conclusion
Control charts are crucial for monitoring of inspection characteristics of process and/or manufactured products and they have special value in the healthcare industry. Normality and continuous nature of data are among the prerequisite for variable-type Individual-Moving Range (I-MR) control charts. However, Some cases showed that Individual (I) chart portion may show great similarity with its counterpart Laney-modified attribute charts without the need for transformation to approach normalisation using statistical software programs such as Minitab. The present observation demonstrated equivalency in the control limits and previous work showed - in addition - coincidence with some types of alarming signals in Shewhart chart but using I-MR charts which possess advantages of the variable control charts of greater sensitivity in alarm detection may take the privilege. Further thorough studies are needed to investigate this issue and to elucidate the validity of this application in similar cases. Application of SPC tools in the healthcare industry is of paramount importance. The easier the way of implementation of control charts could be achieved, the more convenient they become. The currently demonstrated example showed a significant similarity between two different types of control charts without previous processing of raw data which is in agreement with a previous research study. However, an extended confirmative research is required to prove or disprove this assumption.
Acknowledgements
N/A
Conflict of Interest
None to declare.
Keywords: Laney Attribute; I-MR; KS Test; Normality; Variable Chart; Poisson distribution
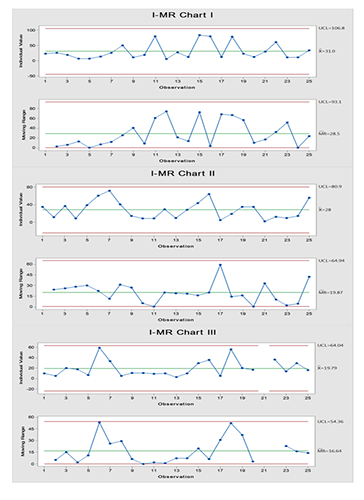
Figure 2. I-MR charts of passive air sampling data where the upper limit is of concern for the microbiological results showing that the process is under control
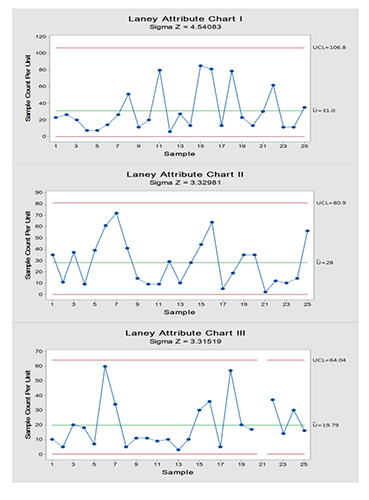
Figure 3. Laney attribute charts of passive air sampling data where the upper limit is of concern for the microbiological results showing that the process is under control
References
BALESTRACCI, D. (2011). Four Control Chart Myths from Foolish Experts | Quality Digest. [online] Qualitydigest.com. Available at: https://www.qualitydigest.com/inside/quality-insider-article/four-control-chart-myths-foolish-experts.html [Accessed 7 Jan. 2019].
Carey, R.G., Stake, L.V. (2003). Improving healthcare with control charts: basic and advanced SPC methods and case studies. ASQ Quality Press, Milwaukee, Wisconsin, USA.
Costa, R. (2014). Control Charts and Non-Normal Data | BPI Consulting. [online] Spcforexcel.com. Retrieved 6 October 2018, from https://www.spcforexcel.com/knowledge/variable-control-charts/control-charts-and-non-normal-data
Eissa, M.E., Mahmoud, A.M., Nouby, A.S. (2016). Active versus Passive Microbiological Air Sampling Risk Assessment: Relation and Comparative Study in Pharmaceutical Industry. Research & Reviews: A Journal of Pharmaceutical Science, 7(1): 13-27.
Eissa, M.E., Mahmoud, A.M., Nouby, A.S. (2015). Control Chart in Microbiological Cleaning Efficacy of Pharmaceutical Facility. Dhaka University Journal of Pharmaceutical Sciences, 14(2):133-8. DOI: http://dx.doi.org/10.3329/dujps.v14i2.28501
Eissa, M.E. (2016). Microbiological Assessment of Compressed Air at a Pharmaceutical Industry: Statistical Process Control. Journal of Applied Pharmaceutical Sciences – JAPHAC, 3(1): 23-28.
Eissa, M.E. (2018). Variable and Attribute Control Charts in Trend Analysis of Active Pharmaceutical Components: Process Efficiency Monitoring and Comparative Study. Experimental Medicine (EM), 1(1):31-44. DOI: 10.31058/j.em.2018.11003
McNeese, B. (2006). Selecting the Right Control Chart | BPI Consulting. [online] Spcforexcel.com. Available at: https://www.spcforexcel.com/knowledge/control-chart-basics/selecting-right-control-chart [Accessed 7 Jan. 2019].
MINITAB 17. Getting started with Minitab 17; 2013.
Minitab Editor. (2012). Transformers! Normal Data in Disguise?. [online] Blog.minitab.com. Retrieved 6 October 2018, from http://blog.minitab.com/blog/quality-data-analysis-and-statistics/transformers-normal-data-in-disguise
Minitab Editor. (2013). How to Create and Read an I-MR Control Chart. [online] Blog.minitab.com. Retrieved 6 October 2018, from http://blog.minitab.com/blog/understanding-statistics/how-create-and-read-an-i-mr-control-chart
Minitab® 18 Support (2017). Data considerations for I-MR Chart - Minitab. [online] Support.minitab.com. Available at: https://support.minitab.com/en-us/minitab/18/help-and-how-to/quality-and-process-improvement/control-charts/how-to/variables-charts-for-individuals/i-mr-chart/before-you-start/data-considerations/ [Accessed 7 Jan. 2019].
QI Macros Tips (2018). Control Charts and Normality | Does Your Data Need to be Normal?. [online] Qimacros.com. Available at: https://www.qimacros.com/free-excel-tips/control-charts-and-normality/ [Accessed 7 Jan. 2019].
Thor, J., Lundberg, J., Ask, J., Olsson, J., Carli, C., Härenstam, K.P., Brommels, M. (2007). Application of statistical process control in healthcare improvement: systematic review. BMJ Quality & Safety, 16(5):387-99. doi: 10.1136/qshc.2006.022194
Toledo, J.C., Lizarelli, F.L., Junior, S., Bispo, M. (2017). Success factors in the implementation of statistical process control: action research in a chemical plant. Production, 27. http://dx.doi.org/10.1590/0103-6513.220816

Mostafa Essam Former inspector at CAPA. Former research specialist in Biotechnology department at El-Nile Pharmaceuticals. Master degree in pharmaceutical sciences. Microbiology & Raw material QC section head. Writing some cultural and scientific articles in ‘Dubai Cultural’ magazine. Published 100 cultural/scientific articles & one book. Research interest: Pharmaceutical Microbiology & Statistical Process Control.