
Identification of Vaccine Products and Drug Substances by Fourier Transform Infrared (FTIR) Spectroscopy
Marina D. Kirkitadze, Deputy Director, Head of Biophysics and Conformation Unit, Biochemistry Platform, Analytical R&D North America, Sanofi Pasteur Canada.
Bruce W Carpick, Director, Biochemistry Platform, Analytical R&D North America, Sanofi Pasteur Canada
Wayne A Williams, Technologist, Biochemistry Platform, Analytical R&D North America, Sanofi Pasteur Canada
Kamaljit S Bhandal, Associate Scientist, Biochemistry Platform, Analytical R&D North America, Sanofi Pasteur Canada
Kristen N. Kalbfleisch, Co-op Student in the Biochemistry Platform, Analytical R&D North America, Sanofi Pasteur Canada
Sasmit S Deshmukh, Associate Scientist, Sanofi Pasteur Canada
Vaccine manufacturing is a lengthy and complex process; therefore, introduction of rapid and reliable analytical methods are essential to reduce cycle time for in-process and quality control testing. In cases where confirmation of product identity is needed to make a process, testing, or batch disposition decision, a simple test that can be performed with a short turn-around time is highly desirable. In this study, FTIR spectroscopy was used to identify drug substances and final vaccine products representing different stages within the vaccine manufacturing chain. The use of FTIR spectroscopy is presented as a lean technique for product identification.
Introduction
Vaccine manufacturing processes involve numerous steps and can take up to 22 months before the final product can be released for human use [1]. There are typically multiple process monitoring and product quality control tests required to cover the entire process of vaccine manufacturing. In addition, final vaccine products are often complex, containing several different vaccine antigens covering multiple disease indications, along with adjuvants such as aluminum phosphate (AlPO4), which are included in certain formulations to increase immunogenicity. Thus, when testing such products for process monitoring or quality control, it is important to implement lean analytical technologies wherever possible. In particular, quick methods to identify and differentiate final vaccine products are desirable, in order to secure the supply chain and ensure product quality. To achieve this, we assessed the applicability of Fourier Transform Infrared (FTIR) spectroscopy for identification of several commercial vaccine products and drug substances. Absorption spectra of vaccine products in the mid-infrared region have characteristic fingerprint spectral regions, which can be used to identify the specific product. More recently, it has been shown that FTIR can be used to study and differentiate components of complex colloidal vaccine [2].The ability of this technology to quickly and simply identify and differentiate complex products is valuable, especially in facilities where multiple products are manufactured and released, or when manufacturing different products for multiple arms of a clinical trial.
Materials and methods
The following samples were obtained from commercial Drug Substances (DS), final filled products and final bulk products, and tested without further modification. All products contained AlPO4 as an adjuvant.
FTIR spectroscopy was performed using a Vertex 70 FTIR Spectrometer (Bruker Optics, Bremen, Germany), equipped with a cryogenically-cooled MCT (mercury-cadmium-telluride) detector and BioATRII sampling accessory. A sample volume of 20 µL was loaded onto the sample cell of the BioATRII. The spectra were collected at a resolution of 0.4 cm-1 with a wavenumber accuracy of 0.01 cm-1 at 2000 cm-1. The samples were allowed to stabilize for 1 minute on the ATR crystal. Blank (Milli-Q water) and sample measurements were conducted, with each measurement averaging 200 scans. The spectra were collected in the region from 850 to 3000 cm-1. Data acquisition and analysis were performed using the OPUS 6.5 software (Bruker Optics, Bremen, Germany). OPUS automatically subtracts the background (blank) signal from the sample to produce the spectrum for the analyte. All measurements were carried out at 25⁰C using the Haake DC30/K20 temperature controller (Karlsruhe, Germany). After acquiring the FTIR spectra, linear baseline correction with 21 iterations was applied to remove baseline drift using the OPUS software. All figures were prepared in SigmaPlot.
Results and Discussion
Both the drug substance and final product samples showed unique spectral features. In FTIR spectra, individual peaks represent vibrational modes of the molecules under study, and alteration in the local environment of these molecules will be sensed by the peak shifts or appearance or disappearance of certain peaks. This information was used while acquiring and analyzing spectra of these vaccine products. Performance qualification test using the OPUS software was routinely done to verify the instrument suitability.
The DS, which primarily consist of single antigens, can be identified using FTIR prior to subsequent formulation steps (Figure 1).
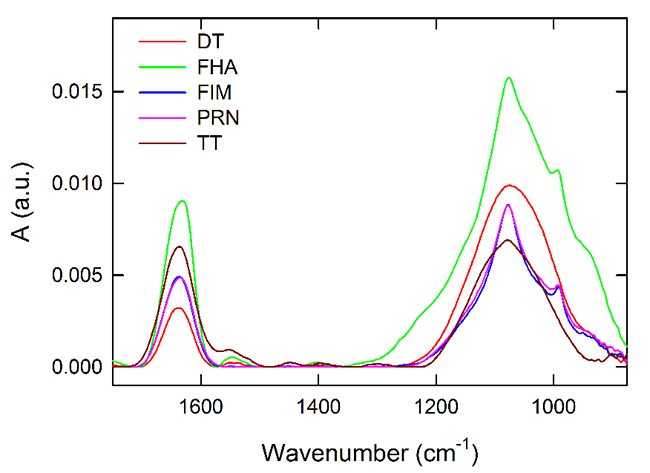
Figure 1. Overlay of FTIR spectra for DT (red), FHA (green), FIM (blue), PRN (pink) and TT (brown).
All of the vaccine antigens tested are purified proteins and thus share some fundamental FTIR spectral features. Moreover, adsorption to AlPO4 adjuvant may differ among antigens according to concentration, pI, or other factors and this may obscure or complicate the analysis of spectral features. As shown in Figure 1, we observed similar spectral features for the antigen DS FHA, FIM and PRN, whereas the DT and TT DS were similar to some extent. In cases where unambiguous distinction is difficult by comparing spectra, calculated 4th derivative spectra can elaborate additional spectral information, as shown in Figure 2. In this analysis, the amide I region is different for each of the tested DS. This region includes changes in β-sheet, turns and α-helices at approximately 1624, 1676 and 1654 cm-1, respectively. Secondary structural content may be influenced as a result of changes to the local environment of the antigens which can also be detected by the shifts in the FTIR peak positions. This demonstrates that most of the antigens can be distinguished by their secondary structural content in the amide I region of the FTIR spectrum. The low frequency region (between approximately 1076 cm-1 and 990 cm-1) consists mainly of contributions from adjuvant and buffer phosphate.
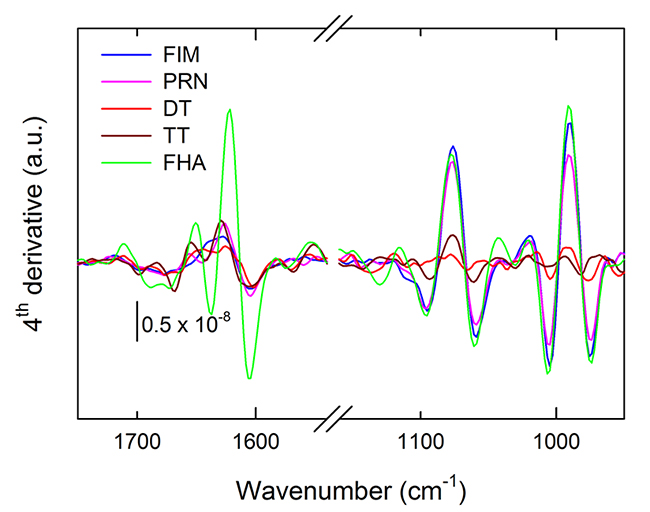
Figure 2.Calculated 4th derivative of spectra from Figure 1.Color code remains similar to Figure 1.
Combination or multivalent vaccine products such as Pentacel®, Pediacel®, and QuadracelTM contain AlPO4 as an adjuvant and multiple similar protein antigens. As a result, the spectral features of the different combination products are quite similar (Figure 3), yet there were small but detectable differences. The peak for P-O stretch around 1079 cm-1 has higher absorbance in QuadracelTM versus Pentacel® or Pediacel®, the latter showing a peak shift to 1083 cm-1. Another spectral difference was observed at 1420 cm-1 with Pentacel and Quadracel both showing a broad shallow peak whereas Pediacel showed a sharper peak at 1414 cm-1.
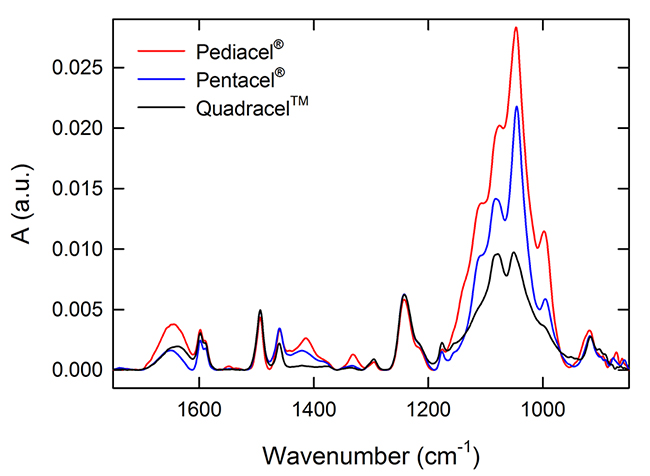
Figure 3. Overlay of FTIR spectra for Pediacel® (red), Pentacel® (blue) and QuadracelTM (black).
Overall, FTIR spectra showed rich information regarding vaccine products and DS that can be used as a spectral fingerprint for each tested sample; therefore, FTIR spectroscopy can be used as a product identification tool for vaccine products and their constituent drug substances.
Conclusion
FTIR spectroscopy can be used as a lean technique for final vaccine product and DS identification. This study demonstrated the capability of FTIR spectroscopy to produce a signature spectrum unique to each of vaccine products tested. Thus, we conclude that FTIR spectroscopy is a sensitive and time-efficient method for product and drug substance identification.
Acknowledgement
This work was supported by Sanofi Pasteur Canada. We would like to thank Bioprocess Research and Development group for generously providing the samples for this study.
Conflict of interest
The authors are all employees of Sanofi Pasteur Canada. The authors have no other relevant affiliations or financial involvement with any organization or entity with a financial interest in or financial conflict with the subject matter or materials discussed in this article. This includes employment, consultancies, stock ownership or options, or royalties. No writing assistance was utilized in the production of this article.
References
1. S. S. Deshmukh, K. S. Bhandal, B. Carpick and M. Kirkitadze (2016) Identification of individual components from the manufacturing chain of a final vaccine product by Raman spectroscopy. Am. Pharm. Rev.http://www.americanpharmaceuticalreview.com/Featured-Articles/190999-Identification-of-Individual-Components-from-the-Manufacturing-Chain-of-a-Final-Vaccine-Product-by-Raman-Spectroscopy/ (accessed on 12 June 2018)
2. S.S. Deshmukh, F.W. Magcalas, K.N. Kalbfleisch, C.W. Carpick, M.D. Kirkitadze (2018) Tuberculosis vaccine candidate: Characterization of H4-IC31 formulation and H4 antigen conformation, J. Pharm. Biomed. Anal., 157, 235-243. DOI: 10.1016/j.jpba.2018.05.048
Keywords
FTIR spectroscopy, vaccine product, drug substance

Marina D Kirkitadze is Deputy Director, Head of Biophysics and Conformation Unit at Biochemistry Platform, Analytical R&D North America, and 16 year experience in Sanofi Pasteur Canada. Marina received her PhD at the Institute of Protein Research, Russian Academy of Sciences, Pushchino, Russia, and her MBA from the University of Phoenix, AZ, USA.

Bruce W Carpick is Director, Biochemistry Platform, Analytical R&D North America, Sanofi Pasteur Canada, Toronto, Ontario. He has more than 19 year experience in vaccine formulation and analytical development. He received his Ph.D. in Medical Biophysics from the University of Toronto and performed postdoctoral research in Cancer Biology at the Lerner Research Institute, Cleveland Clinic Foundation.

Wayne A Williams is a Technologist in the Biochemistry Platform, Analytical R&D North America, Sanofi Pasteur Canada. He has over 33 year experience in vaccine manufacturing and analytical development at Sanofi Pasteur. He received his Chemical Laboratory Technician diploma from Seneca College, Toronto.

Kamaljit S Bhandal is an Associate Scientist in the Biochemistry Platform, Analytical R&D North America, Sanofi Pasteur Canada. He completed his Master of Biotechnology at University of Toronto and his undergraduate studies at McGill University. Before joining Sanofi Pasteur, Kamaljit has worked with pre-clinical studies at Charles River Laboratories.

Kristen N Kalbfleisch is a former Co-op Student in the Biochemistry Platform, Analytical R&D North America, Sanofi Pasteur Canada, Toronto, Ontario. She is a graduate of the University of Waterloo, and is currently pursuing further education in biotechnology at Seneca College in Toronto.

Sasmit S Deshmukh is an Associate Scientist at Sanofi Pasteur Canada, Toronto, Ontario. He received his PhD in chemistry at Concordia University, Montreal, QC. He has over 10 years of extensive multidisciplinary research experience in chemistry, biochemistry and biophysics.


