
Pharmaceutical Component Kinetics
Inventory dynamic control is crucial
Mostafa Essam, Mostafa Essam Former inspector at CAPA. Former research specialist in Biotechnology department at El-Nile Pharmaceuticals. Master degree in pharmaceutical sciences. Microbiology & Raw material QC section head. Writing some cultural and scientific articles in ‘Dubai Cultural’ magazine. Published 100 cultural/scientific articles & one book. Research interest: Pharmaceutical Microbiology & Statistical Process Control.
Inventory dynamic control is crucial for monitoring of the pharmaceutical component kinetics. In the present long-term study, the packaging material components mobility will be studied using statistical process control methodologies. The most frequent stock items were considered based on Pareto principle and would be subjected to the focus group analysis.
Introduction
Packaging Material (PM) components - either primary, secondary or tertiary - are important for the medicinal product identity, safety and stability, despite they are not part of the dosage forms. PM importance is evident from many recalls of drug products recorded in FDA database for various reasons such as mislabeling and contaminated materials [1]. Descriptive statistics for the overall recorded stock of PM items could be described briefly as in Table 1. Inventory dynamic control is required to track the mobility of the shipped items until availability for further production processing. This is called herein ‘Lag Time’ which is the time elapsed between the incoming shipped item to warehouse till its disposition. During this period, the material is quarantined in a specific hold area and cannot be used except for sampling to inspect the conformance of the material to the quality characteristic attributes. The overall deviation in the lag time of all PMs is 8.2 per cent from the normal trend of the PM hold period. In the present study, Statistical Process Control (SPC) tools were applied using a statistical software package to prioritise critical items based on delivery frequency, lag time and the defect rate. Database of PM products were processed by arrangement, segregation and stratification. Then, extracted data were analysed using SPC program as conducted in previous researches [2-4]. An Inventory Dynamic Index (IDI) would be developed from this quantitative simulation of the material stock mobility before incorporation into the manufacturing process cycle.
Simulation Quantitative Long-Term Case Study
Pareto analysis was useful in the determination of the major contributors as PM components and the most frequent suppliers for each. In Figure 1, three components only of PM contributed by more than 60 per cent of the total PM stock traffic. Boxes (as secondary PM) and bottles with closure (as primary PM) accounted by more than one-third and one-fourth of the overall incoming PM inventory during long-term monitoring study based on the rate of receiving of the items in the warehouse. The critical supply chain for PM items from the huge number of the manufacturer ranged from two to four critical suppliers denoted in Figure 1 and showed contribution by more than 87 per cent from the total suppliers of PM. Those manufacturers may create a focus group that should receive relatively greater attention (but not to underestimate the others, especially newly introduced sources) than other minor and much less frequent communicated providers in Quality Management System (QMS) programs such as the external auditing [5]. Complementarily, the three most influential PM items were studied as defect proportion from the overall received batches. Moreover, rare event control chart was used to access the probability of PMs arrival to the warehouse. On the other hand, Laney-modified attribute control showed the lag time trend of the studied PM. The imitation behaviors are shown in Figures 2 to 4. Batches with unusually high lag time or long time interval between the received material batches were marked by red dots as an out-of-control points ‘1’ in the process behavior charts [6]. Nevertheless, it could be found that lower out-of-control points ‘B’ in the downside of G-charts are indicative more than one shipment or batch were delivered at the same day [7]. Shifting in the mean of the lag time was scored by number ‘2’ out-of-control.
Inventory Dynamic Index (IDI) is a mean of preferential prioritisation of PM items quantitatively by combining the monitored inspection properties using multiplication of lag time upper threshold - as Upper Control Limit (UCL) - and deficiency rate (+1 to avoid zero value, if there are not any defected units) with event probability and the average batch quantity expressed as multiples of ten thousand (i.e. x10,000). This actually a modification from Failure Modes and Effect Analysis (FMEA) using a scoring system that yields Risk Probability Number (RPN) for processing step evaluation [8, 9]. Multiplication is a way to amplify small differences when comparing several processes or the same parameter deterioration/improvement over time or before and after impacting action or incidence. It could be viewed as a measure of the mobility and availability of specific PM item from its arrival to the disposition.
A Worked Example of IDI from Processed Simulation Data
The selection of the multiples for value of the delivery quantity of the shipped batch is dependent on the minimum digit number of the units delivered for PMs based on the long run trending e.g. if the history showed that the lowest number of the received units for a particular packaging component was 10,000 Packaging Unit (PU) then the batch will have quantity unit of ‘one’ for multiple ‘x 10,000’ and all other lot quantities for different shipments should be divided by 10,000. Application of IDI on the most frequent PM components from Figure 1 yields 59.13 for boxes, 55.73 for bottles and 68.41 for closures (the greater value reflects a greater weight) from data in Figure 2 to 4. Interestingly, it appeared that relatively small changes in the delay days due to the inspection process for the release of PM and the minute variation of the already low rate of non-conformities played minor rule if compared with the number of material units that have been received per batch and the probability of receiving a particular packaging item. This might be an indication of that the mobility of certain PM is strongly affected by the rate of the delivery of the PM per day. In addition, it could pinpoint to that the other two factors are linked to the event probability, since there is no significant correlation was found between the batch quantity and lag time at 95 per cent confidence interval (CI) using Spearman non-parametric correlation analysis [10]. Thus, other factors could influence the length of the lag times rather than the total number of units from the incoming batches of PM components.
PMs Timing Delivery and Rhythm Patterns
Long-time monitoring of the chronological pattern of PMs arrival and registration in the inventory stock could be observed in Figure 5 where the most frequent items i.e. boxes, bottles and closures have similar delivery time distribution demonstrated through Contour diagram which showed the relation between three variables in two dimensions figure [11]. This abrupt shift in the arrival periods that have occurred recently at early 2018 probably might be attributed to the change in the regulations of the restriction time on movement of the cargo vehicles from day times to the less crowded times from midnight to the morning. Also, it could be demonstrated that there are excursions with variable degrees for boxes, bottles and closures in terms of batch size/lag time at the following rates 0.052/0.046, 0.012/0.088 and 0.012/0.065, respectively which could be indicative for intermittent departure from the normal rhythm of inventory workflow due to exceptional incidents [12, 13]. On the other hand, the differences between lag times for dispositions and batch sizes between the three groups over long run are statistically insignificant at α=0.05 [14, 15]. Hence, the three major packaging components are comparable in quantity and hold time when analysed using a nonparametric test.
Table 1: Column statistics of the total PM components inventory as would prepared for simulation analysis
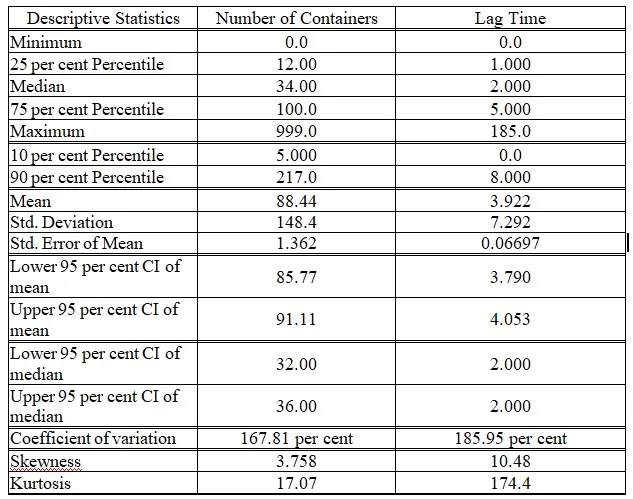
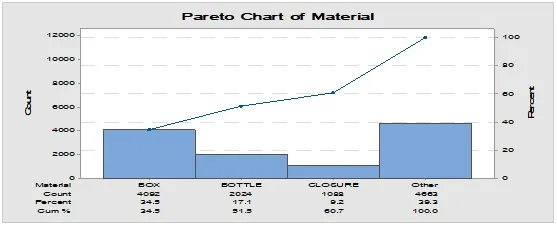
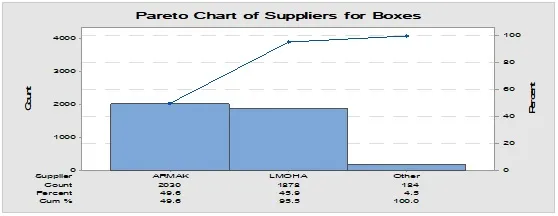
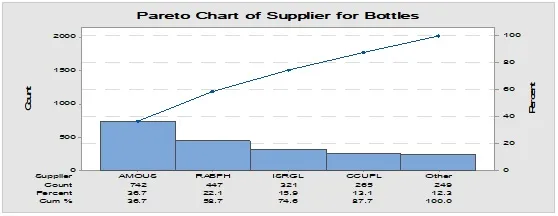
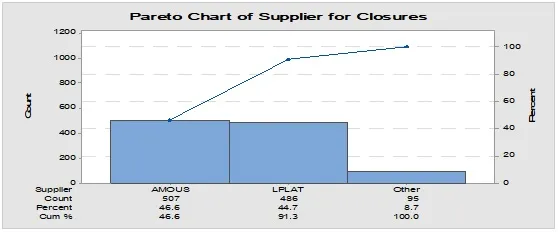
Figure 1: Pareto chart showing the most frequent packaging material components involved in the inventory and the most common supplier for each one.

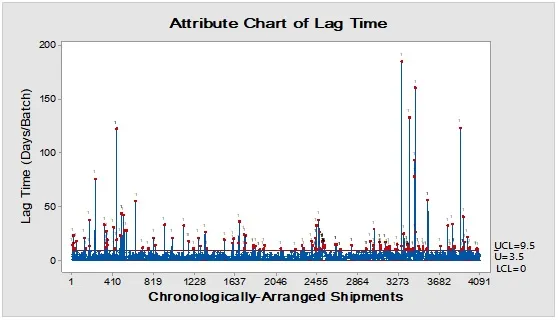
Figure 2: Trend analysis of boxes used as a secondary packaging material for pharmaceutical products.
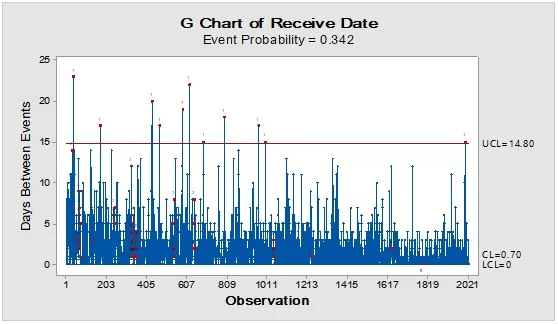

Figure 3: Trend analysis of bottles used as a primary packaging material for pharmaceutical products.
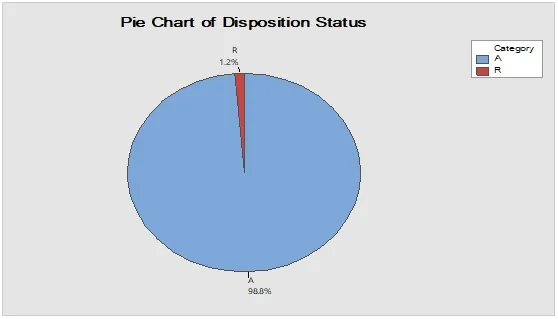
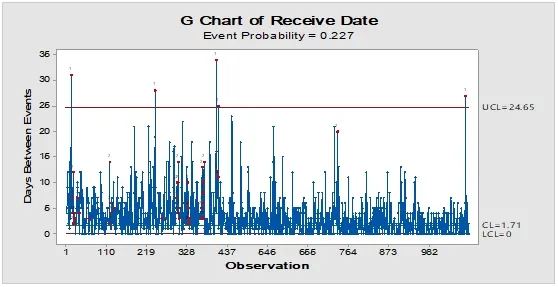
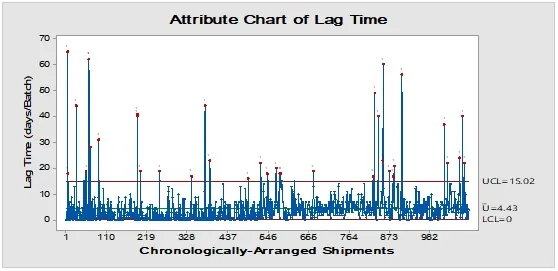
Figure 4: Trend analysis of closures used as a primary packaging material for pharmaceutical products.
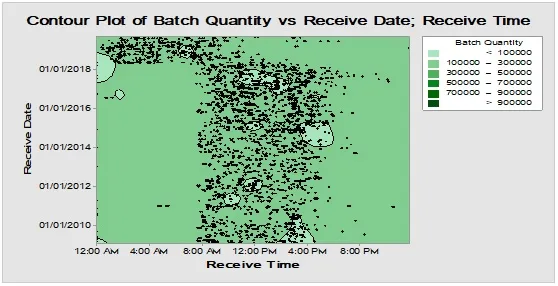
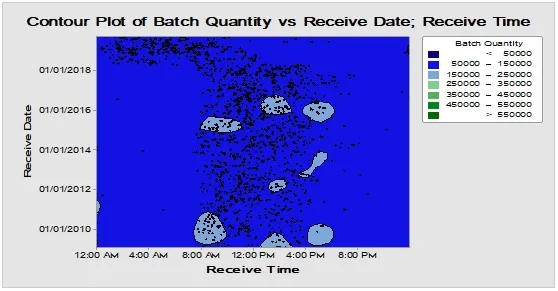
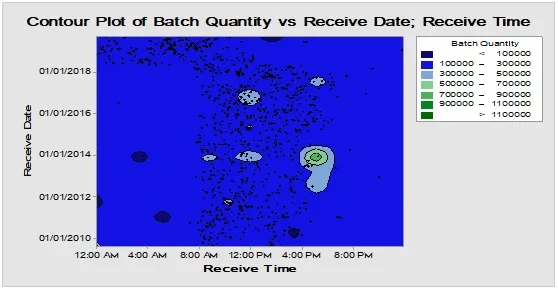
Figure 5: Contour diagram for boxes, bottles and closures (from top downward) showing chronological pattern of PMs delivery to warehouse during long time monitoring.
Conclusion and Lesson Learned
The systematic approach of inventory analysis involves spotting the most frequent materials then identifying the major sources of these packaging products. The kinetics of each PM is subjected to a quantitative analysis using SPC. The combination of different factors in a single index value provides a metric for the dynamic weight of each material. In the present case, boxes were the most critical PM with the highest rate of delivery to the warehouse. The adopted index included the three main measurable influential factors that impact the materials stock kinetics till disposition. Further extension of this analysis is recommended to supplement the first half which should include the processing of the materials till the delivery of the final products and its disposition status.
References
1. Eissa M. Rare event control charts in drug recall monitoring and trend analysis of data record: A multidimensional study. Global Journal on Quality and Safety in Healthcare. 2019;2(2):34.
2. Essam Eissa M, Hamed HS. Application of Statistical Quality Control Tools for Monitoring of Pharmaceutical Product Properties. Biological Sciences - PJSIR [Internet]. 9Apr.2019 [cited 21Sep.2019];62(1):39-8. Available from: https://v2.pjsir.org/index.php/biological-sciences/article/view/350
3. Eissa M. Extended application of statistical process control-quantitative risk assessment techniques to monitor surgical site infection rates. International Medicine. 2019;1(4):225.
4. Eissa M. Application of Control Charts in Monitoring of Surgical Site Infection Trending Records Using Statistical Software. Asian Journal of Applied Sciences. 2019;12(2):76-84.
5. Kent R. External Audit - an overview | ScienceDirect Topics [Internet]. Sciencedirect.com. 2019 [cited 21 September 2019]. Available from: https://www.sciencedirect.com/topics/engineering/external-audit
6. All statistics and graphs for Laney U' Chart - Minitab [Internet]. Support.minitab.com. 2019 [cited 26 September 2019]. Available from: https://support.minitab.com/en-us/minitab/19/help-and-how-to/quality-and-process-improvement/control-charts/how-to/attributes-charts/laney-u-chart/interpret-the-results/all-statistics-and-graphs/
7. Example of G Chart - Minitab [Internet]. Support.minitab.com. 2019 [cited 26 September 2019]. Available from: https://support.minitab.com/en-us/minitab/18/help-and-how-to/quality-and-process-improvement/control-charts/how-to/rare-event-charts/g-chart/before-you-start/example/
8. Risk Priority Number (from Failure Modes and Effects Analysis) [Internet]. Ihi.org. 2019 [cited 21 September 2019]. Available from: http://www.ihi.org/resources/Pages/Measures/RiskPriorityNumberfromFailureModesandEffectsAnalysis.aspx
9. Herman M. RPN - FMEA Risk Priority Number [Internet]. Fmea-fmeca.com. 2019 [cited 26 September 2019]. Available from: http://www.fmea-fmeca.com/fmea-rpn.html
10. GraphPad Statistics Guide [Internet]. Graphpad.com. 2019 [cited 26 September 2019]. Available from: https://www.graphpad.com/guides/prism/7/statistics/index.htm?stat_interpreting_results_correlati.htm
11. Interpret the key results for Contour Plot - Minitab [Internet]. Support.minitab.com. 2019 [cited 26 September 2019]. Available from: https://support.minitab.com/en-us/minitab/19/help-and-how-to/modeling-statistics/using-fitted-models/how-to/contour-plot/interpret-the-results/key-results/
12. How it works: ROUT method [Internet]. Graphpad.com. 2019 [cited 26 September 2019]. Available from: https://www.graphpad.com/guides/prism/7/statistics/stat_how_it_works_rout_method.htm?toc=0&printWindow
13. Steland A. Book Review: Fitting Models to Biological Data Using Linear and Nonlinear Regression. By Harvey Motulsky und Arthur Christopoulos. Biometrical Journal. 2006;48(2):327-327.
14. GraphPad Statistics Guide [Internet]. Graphpad.com. 2019 [cited 26 September 2019]. Available from: https://www.graphpad.com/guides/prism/7/statistics/index.htm?how_the_kruskal-wallis_test_works.htm
15. Motulsky H. Analyzing Data with GraphPad Prism [Internet]. Nicspaull.files.wordpress.com. 1999 [cited 26 September 2019]. Available from: https://nicspaull.files.wordpress.com/2011/04/analyzingdata-graph-pad.pdf

Former Inspector, CAPA