
Prioritisation of Raw Materials in Healthcare Industry
Using statistical process controltools for stock management
Mostafa Essam Eissa, Mostafa Essam Former inspector at CAPA. Former research specialist in Biotechnology department at El-Nile Pharmaceuticals. Master degree in pharmaceutical sciences. Microbiology & Raw material QC section head. Writing some cultural and scientific articles in ‘Dubai Cultural’ magazine. Published 100 cultural/scientific articles & one book. Research interest: Pharmaceutical Microbiology & Statistical Process Control.
Management of the pharmaceutical inventory is important in controlling and monitoring the mobility of the items in stock. The aim of the present study is the development of an effective yet simple mean over ten years of recording and observation for analysis and control of the raw materials stock.
Introduction
An establishment ofan appropriate and effective system for monitoring and control of the goods mobility in the warehouses is an important integral part of GXP to ensure an uninterrupted flow of the manufacturing industrial work. This process should be done without any shortage or overstocking of the inventory materials and intermediate products to avoid any kind of wastes. Importantly, this issue is crucial in the healthcare sector notably the pharmaceutical field. The presented case herein will focus on using some of the statistical process control (SPC) techniques to provide fast and simple long-run quantitative evaluation ofraw materials (RMs) weight in inventory mobility.
Multidimensional Statistical Analysis
The current investigation would make use of statistical software packages in a long-term analysis through SPC methodologies to minimise storage waste and determine the following as a part of inventory management for control and reallocation of resources and improvement of the stock monitoring: First, the most critical items of RMs that were delivered to warehouses from different perspectives such as frequency of the delivery, overall lag (retention in the holding area in the warehouse till disposition either for further processing or rejection and return to the vendor) time and non-conformities rates using Pareto plot analysis. Second, determining the most critical time of the day through which most of the shipments would arrive at the destination through contour plots. Third, the long run defection rate of the delivered materials would be assessed using Pie diagrams. These demonstrations could be found in Figures 1 and 2. The most mobile items in the stock could be further sifted using statistical analysis in Table 1 and the application of SPC tools (Figures 3 to 8). Moreover, the use of trending charts for the crucial RM stock items to show the behavior of the inventory in terms of retention time and the probability of arrival using Laney-modified attribute and rare event control charts.
Detailed Analysis
Detailed analysis of the highly dynamic RMs inventory is important in the assessment of the mobility of the items and studying the most crucial materials with the greatest stock weight. This investigation is complementary to a previous one done for packaging material products. Long-term monitoring of the raw material (RM) deliveries showed that the most frequently shipped 33 items – constituting 60% from the overall RM shipments - among more than 450 RMs to the warehouse.These materials could be listed as the following:Acetaminophen (5%), L-3-Ketothreohexuronic Acid LactonePellicles (5%), (S)-3-Isobutyl-γ-Aminobutyric Acid(5%), Flavors/Oils (4%), 6-Methoxy-2-[(4-Methoxy-3,5-Dimethylpyridin-2-yl)Methanesulfinyl]-1H-1,3-BenzodiazolePellicles (4%),Propane-1,2,3-Triol(denoted by GLY) (2%),1-Cyclopropyl-6-Fluoro-4-Oxo-7-Piperazin-1-ylquinoline-3-Carboxylic Acidblend (2%), Film-CoatingSystem (2%), MicrocrystallineCellulose (MCC) (2%),9-Deoxy-9α-Aza-9α-Methyl-9α-Homoerythromycin A (2%), (-)-Ofloxacin (2%), D-glucitol(denoted by SOR) (2%), 1-Ethenylpyrrolidin-2-One(2%), Glyceryl Guaiacolate (1%), Sacharose (denoted by SUC) (1%),Hydroxypropyl Methylcellulose (HPMC) (1%),2-(3-Cyano-4-Isobutoxyphenyl)-4-Methyl-1,3-Thiazole-5-Carboxylic Acid (1%),(RS)-2-Hydroxy-3-(2-Methoxyphenoxy) Propyl Carbamate(1%), Mannite(1%),2-((R)-((3-Methyl-4-(2,2,2-Trifluoroethoxy)-2-Pyridinyl) Methyl) Sulfinyl)-1H-BenzimidazolePellicles (1%), Terfenadine CarboxylateHydrochloride (1%), p-Hydroxybenzoic Acid (5-Nitrofurfurylidene) Hydrazide (1%), Nystatin (1%), DicalciumPhosphate(1%), Lactobiose(1%), Polyoxyethylene (POE)(1%), Propane-1,2-Diol(1%),6-O-Methylerythromycin A (1%), SodiumPhosphate (1%), 2-Amino-4-(Methylthio) Butanoic Acid(1%), Magnesium Octadecanoate (1%),Propan-2-Ol (1%),2-Hydroxypropane-1,2,3-Tricarboxylic Acid(1%) and2-Diphenylmethoxy-N,N-DemthylethanamineHydrochloride (1%).Detailed participations from this 60% fraction were 35% Active Pharmaceutical Ingredients (APIs), including 10% pellicles as semi-finished, 5% Proton-Pump Inhibitors (PPIs),5% antihistaminic and 9% oral antimicrobials/antibioticsin addition to 25% excipients.
In terms of length of lag time till disposition, the descending order of priority for the upper 60% from RMs is listed as the following: 6-Methoxy-2-[(4-Methoxy-3,5-Dimethylpyridin-2-yl)Methanesulfinyl]-1H-1,3-BenzodiazolePellicles (7%),L-3-Ketothreohexuronic Acid LactonePellicles (6%),(S)-3-Isobutyl-γ-Aminobutyric Acid (4%),Acetaminophen(4%),1-Ethenylpyrrolidin-2-One (2%), Flavor/Oil (2%),9-Deoxy-9α-Aza-9α-Methyl-9α-Homoerythromycin A (2%),MCC (2%),(-)-Ofloxacin (2%),Terfenadine CarboxylateHydrochloride (2%),(RS)-2-Hydroxy-3-(2-Methoxyphenoxy) Propyl Carbamate(1%),Propane-1,2,3-Triol(denoted by GLY) (1%),2-Nicotinamidoethyl Nitrate(1%),Magnesium Octadecanoate(1%),Film-Coating System(1%), D-glucitol(denoted by SOR) (1%),2-((R)-((3-Methyl-4-(2,2,2-Trifluoroethoxy)-2-Pyridinyl) Methyl) Sulfinyl)-1H-Benzimidazole Pellicles (1%),Mannite(1%),POE(1%),Glyceryl Guaiacolate(1%),HPMC (1%),2-(3-Cyano-4-Isobutoxyphenyl)-4-Methyl-1,3-Thiazole-5-Carboxylic Acid(1%),2-Diphenylmethoxy-N,N-Demthylethanamine Hydrochloride(1%), N-(P-(O-1H-Tetrazol-5-ylphenyl)benzyl)-N-Valeryl-L-Valine(1%), Nystatin (1%), 3-Ethyl 5-Methyl 2-[(2-Aminoethoxy)methyl]-4-(2-Chlorophenyl)-6-Methyl-1,4-Dihydropyridine-3,5-DicarboxylateBenzenesulfonic Acid(1%), Lactobiose(1%), Dicalcium Phosphate(1%), Gramicidin D (1%),Propane-1,2-Diol(1%),6-O-Methylerythromycin A(1%), cross-linked polymer of Carboxymethylcellulose (CMC) Sodium(1%),N,N-Dimethylbiguanide Hydrochloride (1%), (+) Threo-2-(Methylamino)-1-Phenyl-1-PropanolHydrochloride(1%),Cetearyl Alcohol(1%), [2-[(2R,3R,4S)-3,4-Dihydroxyoxolan-2-yl]-2-Hydroxyethyl] Octadecanoate(1%),Polyvinylpyrrolidone (PVP) (1%),Sodium Carboxymethyl Starch (CMS-Na)(1%),2-Hydroxypropane-1,2,3-Tricarboxylic Acid(4%)and N-(4-Methyl-3-{[4-(Pyridin-3-yl)pyrimidin-2-yl]amino}phenyl)-4-[(4-Methylpiperazin-1-yl)methyl]benzamide MethanesulfonicAcid(1%). Detailed participations from this 60% fraction were 41% Active Pharmaceutical Ingredients (APIs), including 14% pellicles as semi-finished, 8% Proton-Pump Inhibitors (PPIs), 5% antihistaminic and 9% oral antimicrobials/antibiotics in addition to 19% excipients.
In terms of rejection fraction contribution from total non-conforming batches, the descending order of proportions for the upper 60% from RMs is listed as the following: 2-((R)-((3-Methyl-4-(2,2,2-Trifluoroethoxy)-2-Pyridinyl) Methyl) Sulfinyl)-1H-BenzimidazolePellicles(9%),Flavor/Oil(9%),L-3-Ketothreohexuronic Acid LactonePellicles (7%),Acetaminophen (6%),SodiumPhosphate (4%), MCC (3%), Ethyl Alcohol (3%), D-glucitol(denoted by SOR) (3%), E415 (3%), Dicalcium Phosphate(2%), 2-(3-Cyano-4-Isobutoxyphenyl)-4-Methyl-1,3-Thiazole-5-Carboxylic Acid(2%), 2-Amino-4-(Methylthio) Butanoic Acid(2%), N-(P-(O-1H-Tetrazol-5-ylphenyl)benzyl)-N-Valeryl-L-Valine(2%), (RS)-2-Hydroxy-3-(2-Methoxyphenoxy) Propyl Carbamate(2%), Sacharose(denoted by SUC)(2%),Methyl L-α-Aspartyl-L-phenylalaninate (1%) and 9-Deoxy-9α-Aza-9α-Methyl-9α-Homoerythromycin A (1%).
However, it should be noted that reliance on the previous parameters alone, in this case, might not be enough to demonstrate RM stock weight, especially due to the closeness of ratios between the materials resulting in the flattening of prioritisation monitoring. Complementarily, the bulk or size of the delivered shipments would be more illustrative for storage area/capacity, labor, work efforts and internal/external transport load. Rare events control chart showed that the overall rate of receiving RM per day was 67.4% with no minimum or average delays between batches i.e. equal to zero and maximum delay threshold of about five interval days. Red dots alarms are indicative of either exceptionally high or low aberrant intervals between successively received batches. On spot segregation of RM frequency based on the final disposition, status demonstrated 4.2% rejections and 1.2% pending and under-analysis items which account to approximately 1/20 from the overall arrived shipped lots of RMs. The contour graph illustrated the behavioral trend of RM quantities over dates and times though ten years of recording of inventory data. Outlier determination ratio (expressed as percent) using ROUT (Q = 1.000%) for GLY, SOR and SUC for lots arrival rates 19.8/year, 14.1/year, 11.3/year and 43.7/year in terms of (batch quantity/number of containers/lag time) % was (0.51/0.51/6.06) %, (0.00/0.00/7.80) %, (1.77/0.00/9.82) % and (2.97/3.20/8.70) %.
Process-behavior or trending charts were useful to visualise unique patterns and isolation of the assignable-cause excursions (marked by red dots) from the normal process variations. The long term study showed that only three RMs were responsible for about 0.6 fractions from the total stock materials by weight which contributes significantly to the operation mass mobility and transfer, even if they were not at the utter priority list in the other-dimensional analysis. Thus, they became of prime importance for further analysis to elucidate their dynamic pattern, which will be useful for future modeling with possible adoption of metric analysis for inventory mobility indexing. It is recommended that the overall trend could be segregated based on shorter intervals, such as a yearly basis to provide more accurate predictions for the process demand for the critical inventory materials.
Table 1: Descriptive statistics of long-term inventory data for the four major RMs as quantity, number of containers and the elapsed till since the arrival to the warehouse till the final disposition.
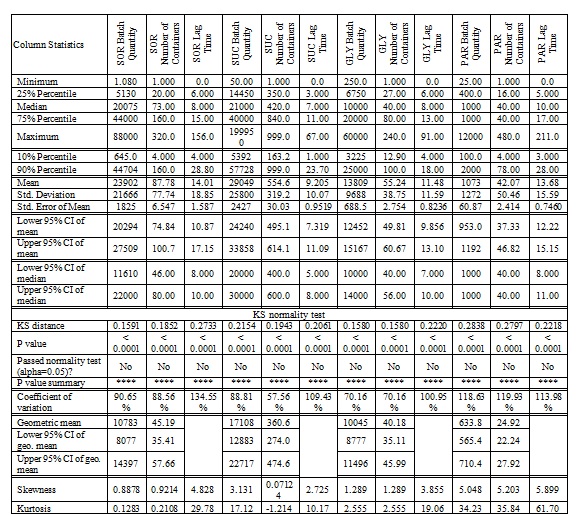
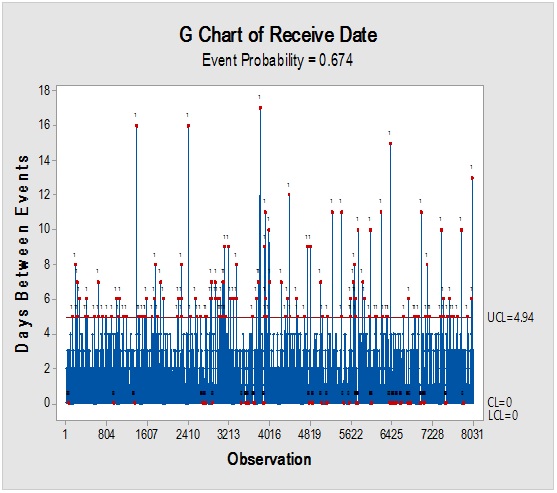
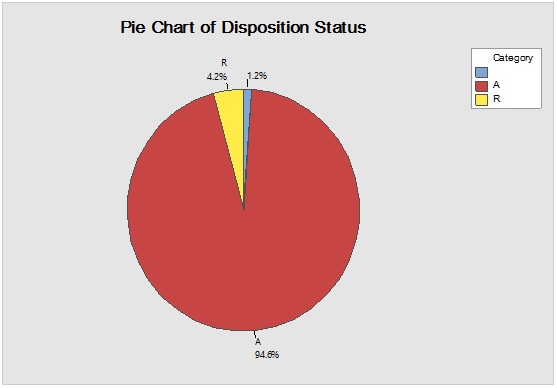
Figure 1: Rare event trending chart of goods reception interval (above) and Pie diagram of disposition status (below) for long term monitoring of the received shipments from RM suppliers.
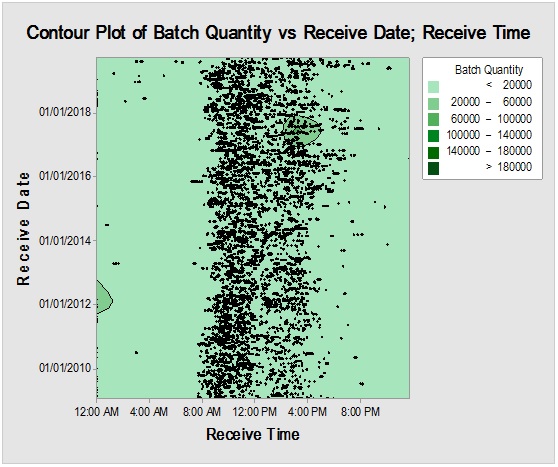
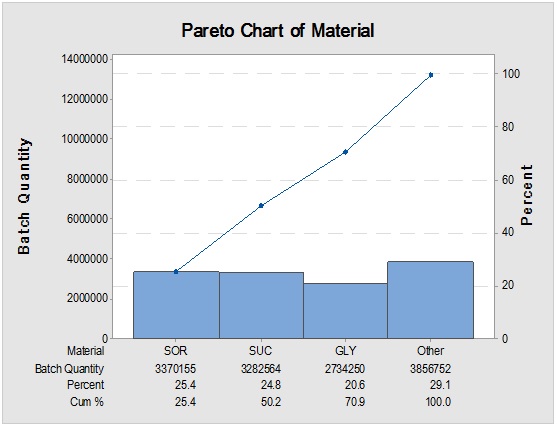
Figure 2: Overall RMs arrival rush hours trend (above) to the warehouse and the items with the greatest weight contribution (below) by the batch amount.
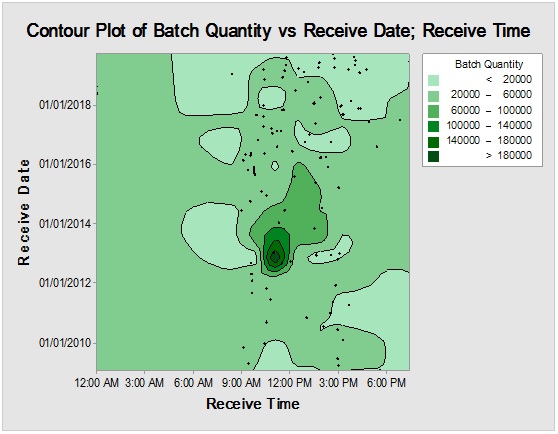
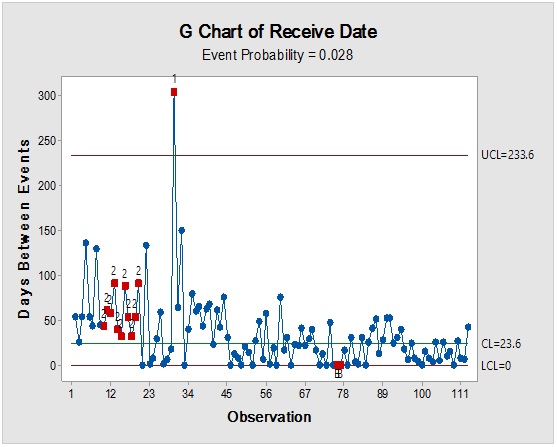
Figure 3: Contour plot showing Sacharose reception time mapping (upper) and rare event trending chart (lower) of the interval time between consecutive batches.
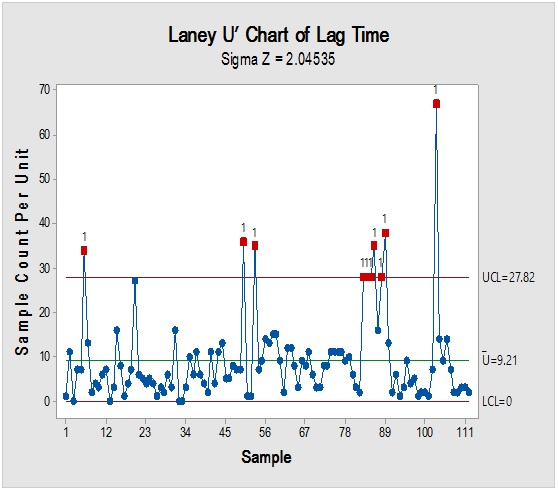
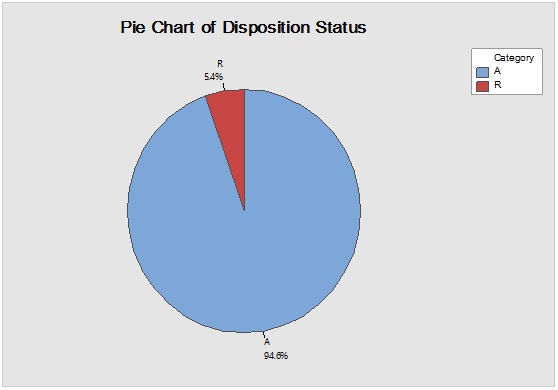
Figure 4: Laney-modified attribute control chart (upper) for Sacharose showing delay time till product disposition and Pie graph (lower) of acceptance rate.
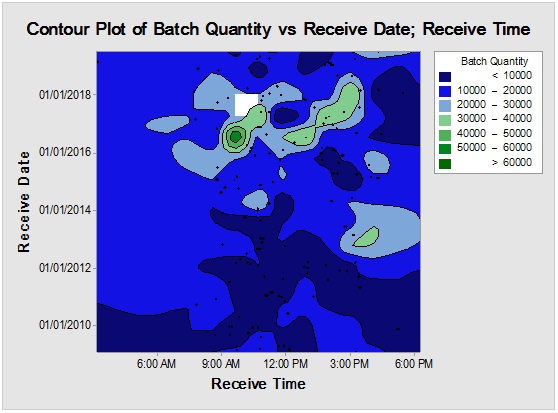
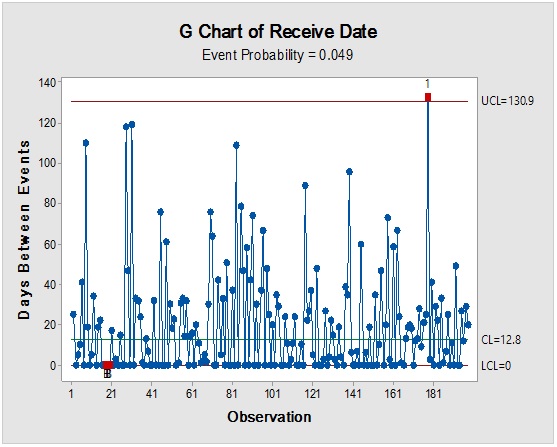
Figure 5: Contour plot showingPropane-1,2,3-Triolreception timemapping (upper) and rare event trending chart (lower) of the interval time between consecutive batches.
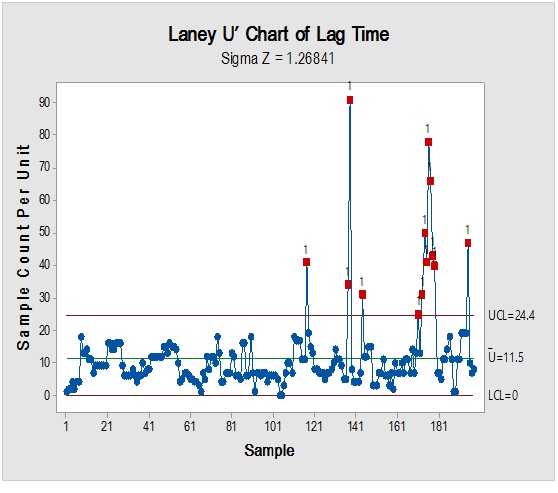
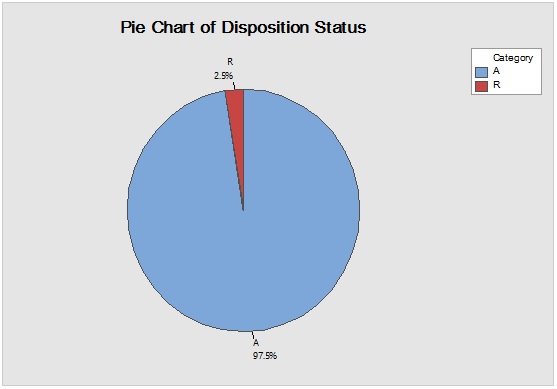
Figure 6: Laney-modified attribute control chart (upper) for Propane-1,2,3-Triol showing delay time till product disposition and Pie graph (lower) of acceptance rate.
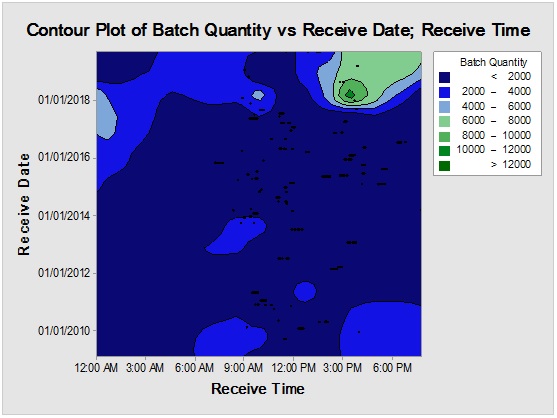
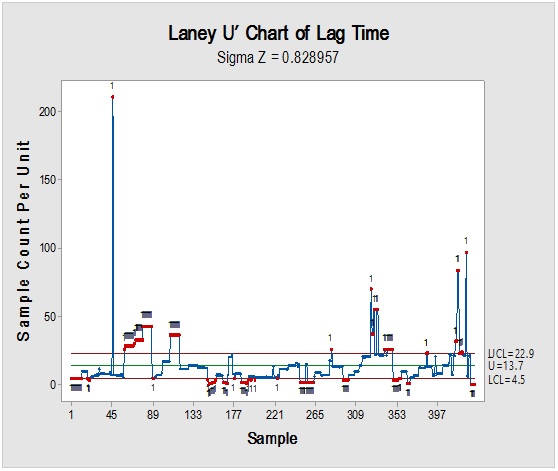
Figure 7: Contour plot showing D-glucitol reception time mapping (upper) and rare event trending chart (lower) of the interval time between consecutive batches.
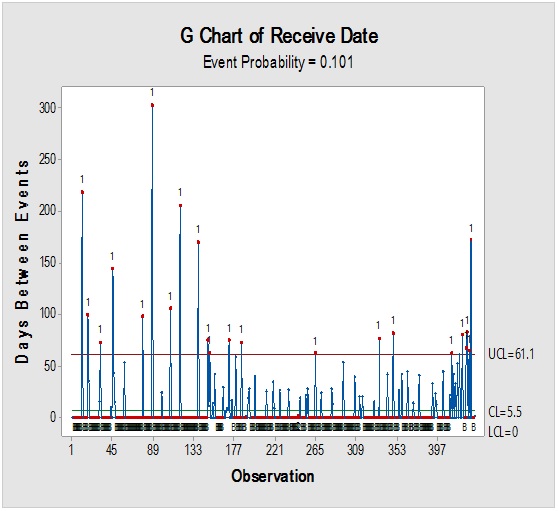
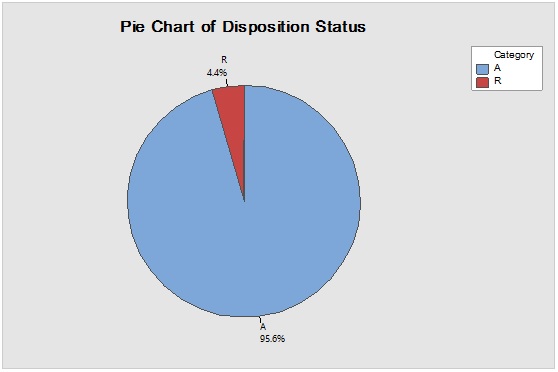
Figure 8: Laney-modified attribute control chart (upper) for D-glucitol showing delay time till product disposition and Pie graph (lower) of acceptance rate.

Independent Researcher, Microbiology and Immunology Department, Cairo University


