
SPC and Evaluation of Analyst Performance
Mostafa Essam, Mostafa Essam Former inspector at CAPA. Former research specialist in Biotechnology department at El-Nile Pharmaceuticals. Master degree in pharmaceutical sciences. Microbiology & Raw material QC section head. Writing some cultural and scientific articles in ‘Dubai Cultural’ magazine. Published 100 cultural/scientific articles & one book. Research interest: Pharmaceutical Microbiology & Statistical Process Control.
SPC are vital tool to monitor the quality of specific characteristics. They can show abnormal trends in data even if results were within the acceptance criteria. Accordingly, the evaluation of the analysts and the analysis reproducibility in a laboratory could be performed at regular intervals to judge their performance quantitatively.
Introduction
Statistical Process Control (SPC) has become valuable tools in different areas in human life notably healthcare industry including the pharmaceutical field. In general, SPC provides a visually quantitative measure for specifically monitored inspection properties. Accordingly, it assesses the degree of control on the investigated characteristic, efficiency, staebility, quality, any improvements required and the impact of changes made on a particular process.
The Quality Control (QC) in the industry generally and the pharmaceutical field specifically has a vital rule that provides insight into the manufacturing steps of any product. However, for rigorous control to be achieved, Good Laboratory Practice (GLP) must be maintained in its optimum state. This could be done by providing regular self-inspection and monitoring through compliance officers in the quality section using SPC. One of the most important criteria to be monitored is the performance level of the analyst staff employees during analysis to determine their work quality, reproducibility, efficiency and the training impact.
There are many commercial pure statistical, SPC and Six Sigma (including Shewhart charts) software program packages that are available in the market. These programs could be easily installed and validated with the aid of Information Technology (IT) of the organisation. Moreover, these programs are user-friendly where continuous online built of data could be added to visualise the trend of the inspected process or characteristic. The following case would demonstrate the above argument.
A case study of the analyst performance assessment in the laboratory for chemical analysis
Reference items
A reference batch of tablet composed of two Active Pharmaceutical Ingredients (APIs) composed of Non-Steroidal Anti-Inflammatory Drug (NSAID) and muscle relaxant of Carbonic Anhydrase class. The experiment was controlled by the compliance officer who determined the regular schedule periods for the reassessment times.
Subjects of the study
QC analysts of the central laboratory for the analysis of the finished and semi-finished pharmaceutical dosage forms. All instruments and types of equipment involved in the testing procedures (including electronic balances, dissolution apparatuses and HPLCs) were validated and calibrated regularly by the validation team.
Tests to be evaluated
Dissolution and potency determinations for both APIs. The dissolution test has only Lower Specification Limit (LSL) which is Not Less Than (NLT) 70 % of the dose. While the potency ranges between 90 % as LSL and 110 % as upper specification limit (USL). The analysis methods involved in the standard operating procedure (SOP) include pharmacopeial reference guideline for testing of both compounds.
Commercial Software packages
Raw results will be initially subjected to a descriptive statistical analysis accompanied by normality testing. Shewhart charts will be constructed through variable type of trending charts. Direct data visualisation will be done using individual-moving range (I-MR) chart. Box-and-Whisker diagram, column and descriptive statistics were performed using GraphPad Prism for Windows version 6.01. Control charts were plotted using Minitab® 17.1.0.
Performance evaluation of the analysts
Box plot graph was initially used to visualise data distribution as could be demonstrated in Figure 1. Data gathered from multiple analyses by different analysts showed that spreading is minimum with muscle relaxant assay while greater scattering could be observed with the dissolution of NSAID. A detailed description of the results behaviour could be found in Table 1. Column statistics confirmed what could be visualised in Figure 1 in addition to other important aspects.
All data passed normality tests by two methods (Kolmogorov-Smirnov (KS) and D'Agostino & Pearson omnibus normality test) which were confirmed in Figure 2 and 3 using by Anderson-Darling (AD) test with normal probability diagram illustrated. Centiles, Confidence Intervals (CIs), means (arithmetic and geometric), standard deviation, standard error, a Coefficient of Variation (CV) and a measure of Gaussian distribution distortion (skewness, kurtosis) shown in Table 1 provides a comparison between data generated from different tests.
Figure 2 and 3 are individual-moving range (I-MR) charts for both assay (%) and dissolution (%), respectively. Red points in the charts represent test results that are within the specifications but out-of-control from the expected trends in the diagrams. For example, some analysts give exceptionally high and low result in the assay of both APIs. Each dot represents a single analysis point done by an analyst. It should be noted that the capability test is of little value if the inspected process is out-of-control. However, its presence here is for illustration of the current state of performance and due to the wide test limits (demonstrated in capability histograms and plots); aberrant performance is hidden except when using trending charts. Accordingly, there are some analysts who require further training and review of their analysis work performance to improve their efficacy for good analytical practice especially in the assay test rather than the dissolution analysis. A training program should be improved to enhance GLP of employees.
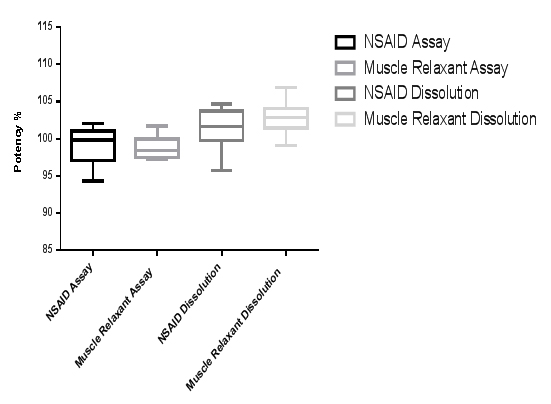
Figure 1: Boxplot diagram showing data spreading and distribution for potency and dissolution tests performed by different analysts for the same product containing two APIs. (Generated using GraphPad Prism v6.01 for Windows)
The trend of the analysis mean is demonstrated by (I) charts. On the other hand, (MR) charts show the stability of the process variations between successive analysis points. Unstable variations in (MR) charts will impact (I) charts resulting in a lack of control on the process. These initial results are the foundation stone on which data are added and built on to obtain general trend line from which long-term general assessment of the overall performance quality could be determined and provide factually based improvements. It is important to note that control charts have the crucial advantage to detect abnormal results due to assignable cause variations and isolate them for common cause variations which facilitate investigations for any deviations either before and/or after excursions have occurred and facilitate root cause identification.
Table 1: Descriptive statistical analysis of data generated by different analysts for the same product containing two APIs. (Generated using GraphPad Prism v6.01 for Windows)
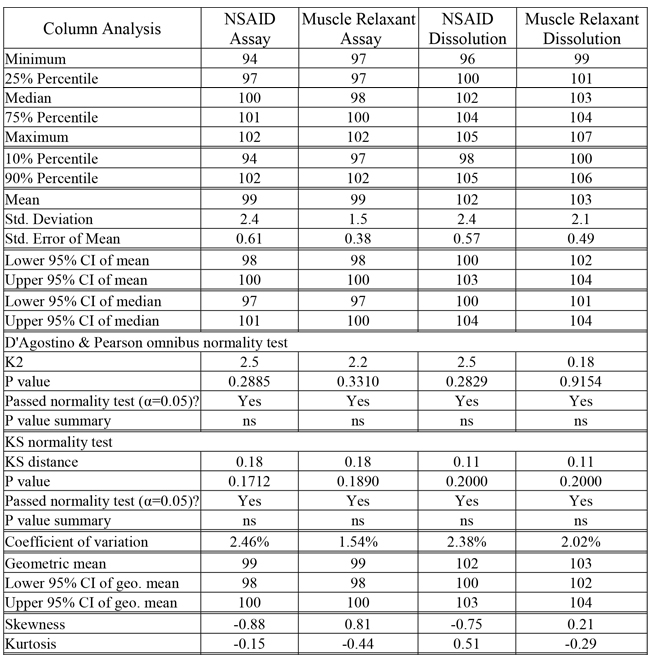
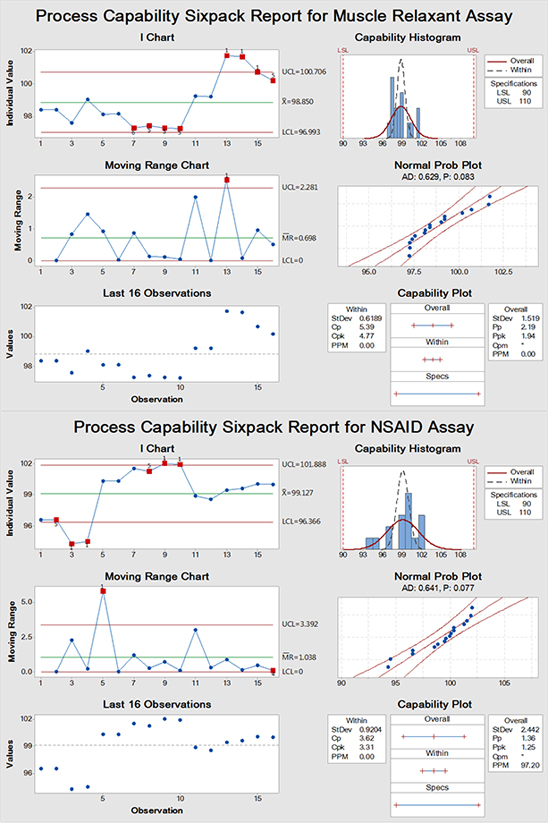
Figure 2: SPC analysis for assay of muscle relaxant and NSAID showing data that are within specification but there are different analysis points that are out-of-control (red dots). (Generated using Minitab® 17.1.0)
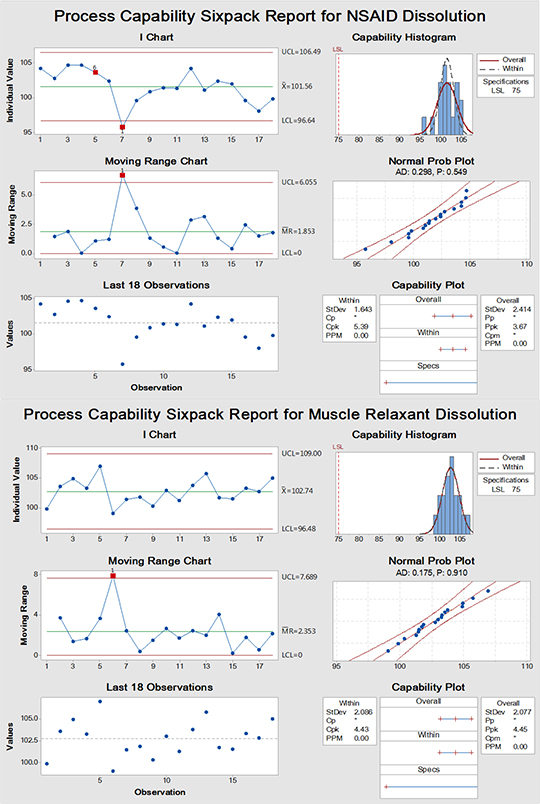
Figure 3: SPC analysis for dissolution test of muscle relaxant and NSAID showing data that are within specification but there are different analysis points that are out-of-control (red dots). (Generated using Minitab® 17.1.0)
Variable control charts are sensitive for warning alarming signals more than their attribute counterpart which is an additional advantage. For instance, they can provide early warning for potential process drift. Also, the current case showed freaky spiking peaks of analysis points from specific analysts "no.1s red alarm dots" probably due to extraneous causes not related to the normal analytical processing steps which requires checking GLP performance and understanding. Only one characteristic alarm no.4" was observed in (MR) chart of NSAID assay. It refers to oscillating process up and down due to what is called stratification due to reciprocating factor(s) between successive analyses. It has been reported previously the importance of SPC, including trending charts in providing a quantitative visual evaluation of general good practices (collectively known as GXP) in healthcare industry. Any drift in from the usual process could be captured and corrected before catastrophic out-of-specification (OOS) could emerge ruining the efforts to deliver safe product and/or service with the intended quality.
Conclusion
SPC provides a valuable mean for monitoring of the degree of accuracy and trustiness of the analysis performed by the analysts. However, the greater the number of results collected (such as 100 readings), the more accurate the conclusion derived from the results. Accordingly, regular monitoring and assessment at relatively short intervals of the workers in the laboratory would provide provision for the possible benefits and drawbacks from the training level received and the modifications required on the system, provided that all other parameters were kept under the control. It would be convenient to update data continuously by adding the results online to visualise the progress on the process in near-real time, even if no apparent excursion could be detected. This will help in taking actions as fast as possible by setting appropriate Corrective Action and Preventive Action (CAPA).
Acknowledgements
N/A
Conflict of Interest
None to declare.
References
Arcidiacono G, Citti P, Pratesi I. Six Sigma for quality management. Quality, Reliability and Maintenance. 2004 May 28:123.
Eissa ME, Abid AM. Application of statistical process control for spotting compliance to good pharmaceutical practice. Brazilian Journal of Pharmaceutical Sciences. 2018;54(2).
Eissa ME, Mahmoud AM, Nouby AS. Statistical Process Control in the Evaluation of Microbiological Surface Cleanliness Quality and Spotting the Defects in Clean Area of Pharmaceutical Manufacturing Facility. Haya: The Saudi Journal of Life Sciences. 2016; 1(1):1-17.
Eissa ME. Application of Attribute Control Chart in the Monitoring of the Physical Properties of Solid Dosage Forms. Journal of Progressive Research in Modern Physics and Chemistry (JPRMPC). 2018; 3(1): 104-113.
How to Read and Interpret I-MR Charts | Research Optimus [Internet]. Researchoptimus.com. 2018 [cited 26 October 2018]. Available from: https://www.researchoptimus.com/article/i-mr-charts.php
Lindsay WM, Evans JR. The management and control of quality. South-Western Cengage Learning; 2010.
McLaughlin KM, Wakefield DB. An Introduction to Data Analysis Using Minitab® 17. 5th ed. Connecticut: Pearson Education, Incorporated; 2015.
Montgomery D. Introduction to Statistical Quality Control. 6th ed. Hoboken, NJ: John Wiley & Sons; 2009.
Robinson K. GLPs and the importance of standard operating procedures. Biopharm international. 2003;16(8):38-46.
Statgraphics Technologies I. Statistical Process Control Charts | SPC Software Packages [Internet]. Statgraphics.com. 2018 [cited 26 October 2018]. Available from: http://www.statgraphics.com/statistical-process-control-charts
Swift ML. GraphPad prism, data analysis, and scientific graphing. Journal of chemical information and computer sciences. 1997 Mar 24;37(2):411-2.
Woodall WH, Adams BM, Benneyan JC. The use of control charts in healthcare. Statistical methods in healthcare. 2012 Aug 31:251-67.
World Health Organization. WHO good practices for pharmaceutical quality control laboratories. WHO Technical Report Series. 2010(957).

Former Inspector, CAPA


