
The success of many investigational drugs is dependent on matching treatments with the appropriate target populations. Variability in response to therapy, both with regards to efficacy and to adverse events, is leading the pharmaceutical industry down the path of personalised medicine. Further pushing the process along are government and private insurance payors who are faced with very expensive treatments that can help some but provide little benefit and possible harm to others.
One promising solution to the problem is to identify predictive biomarkers of drug efficacy; circulating proteins that stratify patients into populations of likely responders and non-responders to a proposed therapy. Finding such biomarkers has been challenging due to the complexity of human plasma, the sample of choice, and the availability of technologies for detection and quantification of thousands of proteins. Based on the experience of over 30 pre-clinical and clinical proteomic studies with pharmaceutical partners, an “industrialised” and very productive approach to biomarker discovery and validation has been developed. Results from multiple studies help make the case for accelerating the move to personalised medicine.
Identification of proteins that predict drug efficacy or that stratify patients by stage and severity of disease can be accomplished through a well-controlled and “industrialised” mass spectrometry analysis of plasma samples. The process begins with uniform blood sample collection into tubes containing protease inhibitors along with EDTA. Plasma is prepared according to a standard operating procedure and depleted by antibody affinity of the high and medium abundance proteins that typically obscure biomarkers of interest. The higher abundance proteins that are removed also show reproducible differential expression in many comparisons, but tend to be related to inflammation and other non-specific effects of disease.
Focussing on the fraction of low abundance proteins also makes it possible to be more comprehensive in terms of protein coverage. Isolated proteins from each sample are digested to peptides which are more accurately identified and quantified by a Quadrupole Time of Flight (QTOF) mass spectrometer. Peptides are matched across all samples and compared for peak intensity in each cohort of patients. Those peptides which are differentially expressed are targeted for fragmentation to generate the amino acid sequence which is matched to the parent protein. Peptides identifying the same protein are clustered and subjected to a consistency filter that requires all peptides from the same protein to show very similar behaviour in each patient.
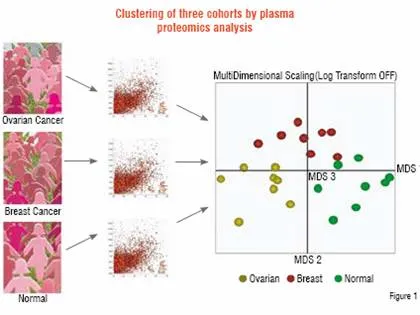
Application of this process to discriminate related diseases can be very informative. In a study performed for a pharmaceutical company, plasma samples were compared between patients with ovarian cancer and breast cancer, as well as with healthy control subjects. Of approximately 50,000 peptide ions tracked across the samples, 4,000 were found to be differentially expressed. These peptides were used to determine the proteomic relationship between the patients by Multidimensional Scaling (MDS), as shown in Figure 1. Each cohort is found to be distinct from the perspective of plasma protein profiles. Thus, not only can patients with disease be distinguished but those with two related diseases can be separated as well. Underlying this clustering at the patient level are specific peptides that were sequenced to identify 181 non-redundant proteins that separated the three groups on a pair-wise basis. These proteins include those involved in acute phase response, tissue damage, as well as cancer.
Ovarian and breast cancer patients were compared to healthy controls (n=8) by Liquid Chromatography-Mass Spectrometry (LC-MS). Approximately 50,000 peptide ions were tracked and compared across all samples to find 4,000 that were differentially expressed. These peptides were analysed by Multidimensional Scaling software to show that each group was distinct from the others (each sphere represents a patient). 181 non-redundant differentially expressed proteins that separate the groups were identified by sequencing the same peptide ions by LC-MS/MS.
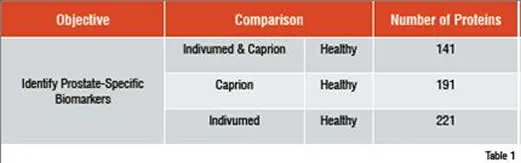
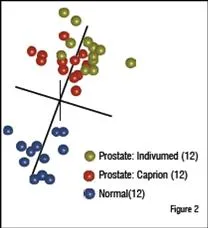
A similar study involved the identification of circulating prostate cancer biomarkers. To determine whether markers could be found in spite of significant differences in sample acquisition, three groups of samples were compared. Healthy control samples came from a commercial supplier. The other two sample sets came from patients with prostate cancer, but from two different suppliers. One supplier was a commercial source. The other was from collaboration between Caprion and the University of Montreal. The three groups were analysed and compared to find peptides that distinguished the two cancer groups from the healthy control. These peptides were used to compare the patients by MDS analysis as shown in Figure 2. The two prostate cancer sample sets were found to completely overlap at the peptide level and the combined cancer group separated well from the healthy controls. Peptides that separated each cancer group from the controls were sequenced to identify approximately 200 proteins in each comparison (Table 1). The interesting finding is that 141 of the proteins in each group were shared, demonstrating that the impact of collecting samples from different sources was relatively minor compared with the effect of the disease on the plasma proteome.
Samples of plasma from patients with prostate cancer were obtained from Indivumed (gold), and from the University of Montreal (red), along with healthy controls from Biological Specialities (n=12). Approximately 43,000 peptide ions were tracked and compared across the samples and 3,569 were found to be differentially expressed. MDS analysis of the differentially expressed peptides reveals that the two sets of prostate cancer samples cluster together and are well separated from the healthy controls.
A total of 271 non-redundant proteins were identified after sequencing the differentially expressed peptides in the prostate cancer comparisons. Similar numbers of proteins separated the Caprion and Indivumed samples from the healthy controls. 141 of these proteins are shared between the two comparisons.
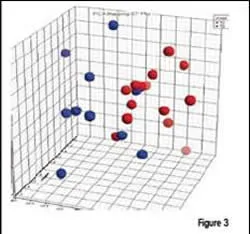
Each of the prostate cancer patient sample groups contained individuals with stage T2 (n=14) and stage T3 (n=10) prostate cancer. A bioinformatics software similar to MDS, was used to compare the patients. As shown in Figure 3, most patients at the two stages could be separated based on their plasma proteomic profiles. Thus, protein expression in plasma is not limited to distinguishing disease, but can be applied to measuring the stage or severity of the disease. The implications of this finding are important to diagnosis and treatment, as well as for monitoring response to therapy.
Proteomic analysis of plasma from prostate cancer patients can be used to distinguish stage of disease. Principal Component Analysis of differentially expressed peptides (courtesy of Centocor, Inc.) shows a good separation of stage T2 (red) from stage T3 (blue) patients.
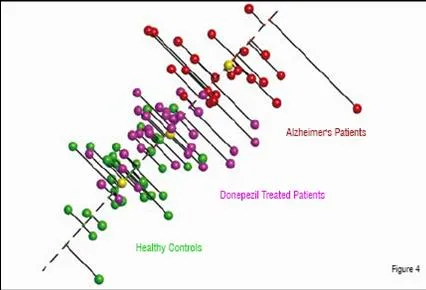
In a third example, plasma was prepared from patients with Alzheimer’s disease as well as from age-matched controls. CNS diseases are thought to be particularly challenging for plasma profiling, since Cerebrospinal Fluid (CSF) is considered to be the fluid most likely to show differential protein expression due to the higher expected concentrations of CNS related proteins. For this comparison, patients were recruited who were naïve to therapy as well as those who had been treated with donepezil. Proteomic analysis identified peptides that were able to separate the untreated patients from the healthy controls (Figure 4). As seen in the previous examples, this is often the case, as patients with disease are quite distinct from those who are healthy. A further analysis was thus performed to determine whether a relationship could be found between distance from the healthy subjects, as seen in the MDS analysis, and a standard test, the MMSE (Mini-Mental State Exam). The correlation between the two measurements was found to be high, with a Pearson correlation score of 0.75, again suggesting that the severity of disease can be measured in a quantitative manner by proteomics. Further, patients treated with donepezil were found to be significantly more similar to the healthy controls than to the untreated Alzheimer’s cohort. This apparent pharmacodynamic effect of the drug may be related to its effect on disease or to some other physiological impact on the plasma. Whatever the cause, the effect appeared to be consistent across the treated patient population. A total of 100 proteins were identified that were differentially expressed in one of the three groups (healthy, Alzheimer’s untreated, and Alzheimer’s treated). Half of these proteins had a neurological association and eight of them had a direct literature link to Alzheimer’s disease.
Alzheimer’s patients treated with the acetylcholinesterase inhibitor, donepezil, (purple) show more similarity to the healthy controls than the untreated Alzheimer’s patients. A “disease axis”, drawn through the centroids (yellow) of the healthy and diseased populations, can be used to quantify the severity of disease.
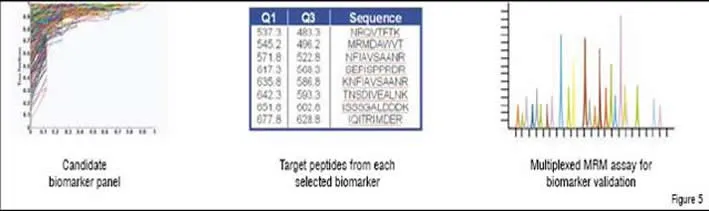
Once proteins are identified that distinguish disease state or effect of a drug, data mining is performed. Differentially expressed proteins are examined for supporting evidence (AUC in a ROC plot, p-value, sequence coverage, biological relevance, and specificity to target or disease of interest) and the best candidates are assembled into a candidate biomarker panel for the creation at Caprion of a multiplexed Multiple Reaction Monitoring (MRM) assay (Figure 5). These assays, made possible by improvements in QTRAP mass spectrometer technology, allow for the quantitative monitoring of 50 or more proteins simultaneously in patient plasma samples. MRM assays are very similar in nature and reliability to standard pharmacokinetic assays for small molecules and can be applied to large numbers of patient samples in a short time frame. Not only are MRM assays much faster to assemble than even a single Enzyme-Linked ImmunoSorbent Assay (ELISA), but they are relatively inexpensive to run and are rapidly gaining in popularity. MRM is on track to replace the ELISA for multivariate assays, particularly when time and cost are of importance.
The best candidate biomarkers are assembled and target peptides and transitions are selected from each to construct the MRM assay as shown in Figure 5. At least 50 protein markers can be combined into the same multiplexed quantitative analysis.
Impact on healthcare
The pharmaceutical industry, driven by the regulatory agencies as well as insurance and government payors, is moving towards personalised medicine. Such an approach will require much better diagnostic markers of disease state as well as predictive markers of drug efficacy. The convergence of a need for better diagnostic and predictive markers and the availability of the tools to identify and implement them will result in major changes to the way we develop drugs in the next few years.