
Industry of today is generating large amount of data. Data that comes from raw materials, excipients, media and the process. Most processes consist of a series of operations (steps) and are also equipped with instrumentations collecting parameters as the process is in operation. The chemometrical analysis of the numerous data collected from such processes provides characteristic patterns relating to groups (classes), trends, and other relationships. The chemometrics technique makes it possible to interpret these patterns and drill down to the possible root cause. The interpretation should when possible be compared with prior process-, chemical-, physical- and biological knowledge. A PAT example illustrates the approach.
Chemistry is primarily an experimental science, where most of the knowledge is based on experiments and measurements, i.e. data is collected under more or less well controlled conditions. Hence, the interpretation of measured data is central to the progress of any project and in any field of chemistry, from physical and inorganic, to biochemistry and molecular biology.
Before the advent of user-friendly computers, around 1965, the only way to interpret these data, i.e. converting the data into easily interpretable knowledge, was to use simple concepts and models, such as mean values for different classes, ANOVA, linear regression and correlation. These were happy times because almost anybody could decide by means of a t-test whether two classes were significantly different or not. Therefore, they could also judge whether a product's quality property had changed significantly with time (Figure 1), and could recognise if there is a significant linear relationship between, say the log of a rate constant and 1/temperature (in degrees Kelvin). However, the situation has changed since 1970s. Now, each experiment derives multiple data from spectra, chromatograms, kinetic experiments, gene arrays, and often combinations thereof. Therefore, the simple averages, t-tests, lines, and slopes do not work anymore.
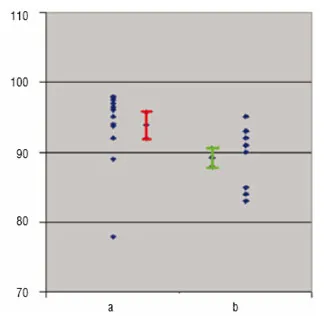
Figure 1
Chemometrics
Chemometrics is specifically designed to handle many data. Around 1970, chemometrics was initiated by Kowalski, Massart, Wold, and co-workers to deal with the data-sets with many variables. Tools such as Principal Components Analysis (PCA) and Partial Least Squares Projections to Latent Structures (PLS) were used to handle many experimental values for the same types of questions as before-whether there are differences between classes of samples, and whether there are significant relationships between sets of numbers, e.g. in a synthesis between (i) experimental conditions (X) and (ii) resulting yield and impurities (Y). The tools of chemometrics are designed to give interpretable results, meaningful to the scientist / engineer. Class differences are expressed as either the data profile related to the class difference, or the data profile for each class. Relationships are expressed in profiles of variation, i.e. which combinations of data are related to each other, how, and in what strength, all with measures of uncertainty such as statistical confidence intervals, and diagnostics for data quality. This makes the interpretation of the results very similar to that of the old days, except that the entities plotted and evaluated are no longer single measurements but are combinations of many. These combinations (called scores) are calculated to maximise their information content with regard to the stated questions-classification or relationships. The weights (loadings) with which the individual measurements are combined to form the scores indicate their relative importance in the measurements, and the correlations between them. An illustration of the basic tools of chemometrics is given by a PAT project run at Novartis, Suffern, USA.
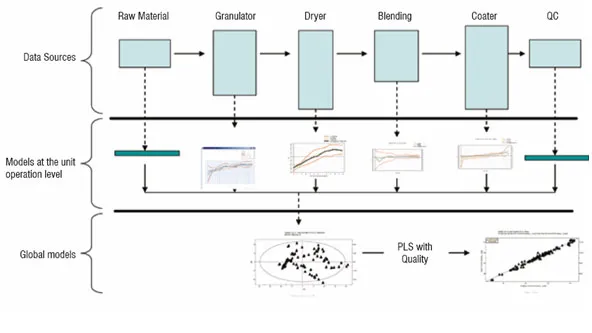
Figure 2
PAT rests on good data, data management and data analysis
The term Process Analytical Technology (PAT) has at least two meanings. First, PAT is a regulatory framework of the FDA for enabling pharmaceutical manufacturers to develop and implement new and efficient analytical tools for use during development, manufacturing and quality assurance to maintain or improve the current level of quality assurance. Second, to the technically oriented pharma community, PAT signifies the technology to achieve real-time quality control in pharma manufacturing, without any decrease in the quality level. This technology includes the instrumentation and sensor arrays providing the data that characterises raw materials, intermediates, products, and the manufacturing process itself, plus the tools to relate the data to the critical quality issues (Figure 2).
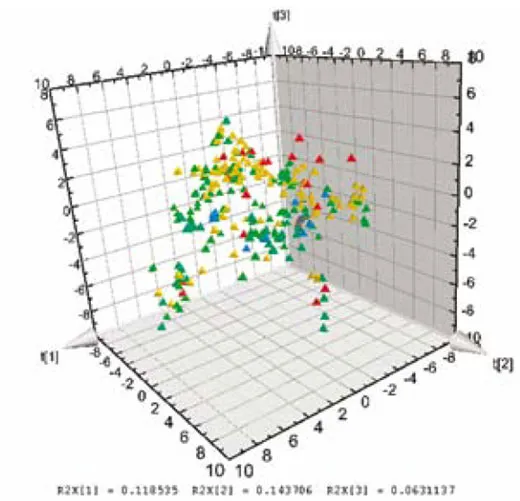
Figure 3
Projections to Latent Structures
With PLS, large datasets containing measurements from raw material quality and manufacturing process conditions can be combined into a single model to identify the cumulative influence of the production environment on the product quality. PLS identifies the sources of variation from the process (X) that correlate with quality (Y). PLS can handle a highly correlated X space retaining a high level of interpretability for interrogation of the model itself, which is essential for development of an understanding of the process and identification of key influences. The hierarchical nature of PLS allows for modular model development, meaning that separate models can be built for raw materials and each unit operation, which later can be combined to form a global view. This allows the starting point for PAT activities to development e.g. end-point detection for a dryer or granulator.
Example of PAT
The pharmaceutical manufacturing process of Novartis, Suffern, New York is discussed here as an example of the approach. The objective of the analysis is to find reasons for a recent change in the process quality, particularly the dissolution rate of the final tablets which often was too low. This is a secondary production process. Drying and compacting were thought to be the steps critical for the dissolution rate of the final product. Each process step is batch-type (non-continuous). On each step, a set of variables (K between 7 and 50) is measured from beginning to the end at regular intervals. In addition, "one shot" point data (characteristics of seven raw materials) and final quality of the batches are measured. The data comprise N = 314 Batches (approximately two years of production).
First, an offline analysis
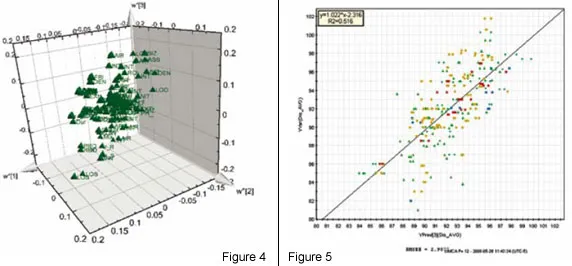
The analysis is based on the ability of PLS to summarise higher order data (3-way dynamic data of batches, i.e. measurements ? time ? batches). Here, only the data collected from the drying steps (two steps) are included in the first analysis of the 3-way data. Summary data, average and standard deviation from first step is used and modelled. The second drying step is dynamic and needs 3 PLS components (y = local time), modelling 50 per cent of the X-variation (the process data). The static and dynamic results are thereafter, together with raw material characteristics, used as X-variables in a second (upper) PLS model, with dissolution rate used as Y in the PLS modelling (Figure 2). A significant relation (3 PLS components) is obtained at the upper level, giving the scores shown in Figure 3. These are coloured by dissolution rate (red is high, blue is low), showing the relationship between the joint score values and the dissolution rate. The corresponding PLS-weights in Figure 4, identify dominant variables (at the lower left and the upper right in the plot). The moderate explanation of y = dissolution rate is seen in Figure 5 which is coloured by time of observation. Recent batches (red = large time values) are seen to have a tendency to have low dissolution values. The coefficients clearly identify the raw materials as dominant factors relating to the variation of the dissolution rate (left half of Figure 6), but a few coefficients of the two dryer phases are also being somewhat important (right half of Figure 6).
Second, online modelling and analysis
The model coefficients were used to modify the control strategies for the dryer also tighter control of the raw materials was implemented. An online monitoring system based on multivariate modelling was then installed, and additional data were included in the modelling covering more of the total process (Figure 2). The results were very encouraging. The dissolution rate stabilised at a higher level, with very little or no inferior product being made. The upper level model was able to have a better accuracy between observed and predicted for dissolution rate and other CQAs, enabling early fault detection and process monitoring.
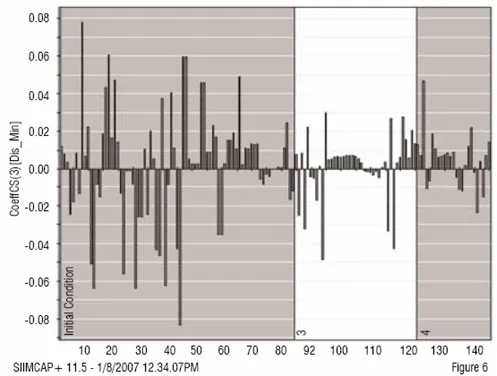
Figure 6
Conclusion
Chemometrics addresses the data explosion and its consequences. The data emerging from chemical laboratories, product development, and manufacturing are nowadays too numerous for traditional statistical tools, and chemometrics has been developed to face this emerging situation. Checking that a process is doing what it is supposed to, is of critical importance in manufacturing (PAT), ensuring that the critical quality attributes are met on the product and the process. Determining the functional relationships that link material attributes and process parameters to product Critical Quality Attributes (CQAs). These results can serve for control strategies, if monitoring and prediction is achieved and understood giving improved process knowledge and process understanding.
References
1. L. Eriksson, et al.: Multi- and Megavariate Data Analysis; Principles and Applications. 2.nd ed: Vol 1 and 2, Umetrics AB, Umea, Sweden, 2006
2. S. Wold et al.: Chemometrics and Intelligent Laboratory Systems 84 (2006) 159-163
3. C. Watts: PAT - A Framework for Innovative Pharmaceutical Development, Manufacturing, and Quality Assurance, FDA/RPSGB Guidance Workshop, 2004