
St.Gallen OPEX Benchmarking for Pharmaceutical Manufacturing Sites
Measure yourself against the best but do it right
Grothkopp. M, University of St.Gallen
Pirrone. L, University of St.Gallen
Friedli. T., University of St.Gallen
An understanding of own performance compared to a meaningful peer group is key to launch and sustain the Operational Excellence (OPEX) journey. The St.Gallen OPEX Benchmarking approach supports companies in that undertaking. This article illustrates how it differs from other benchmarkings and takes a look at the historical development of OPEX in pharma.
Compared to other industries, the history of OPEX in the Pharmaceutical Industry is a relatively short one (Friedli & Werani, 2013). Starting in the early 2000s, pharmaceutical companies began to introduce OPEX methods and tools because of rising cost pressure, the productivity crises in R&D, and the end of the traditional blockbuster business model. These developments, in combination with a push of regulatory authorities to apply as much science to production as to discovery, led to further investments into OPEX activities (Friedli et al., 2013). As more and more pharmaceutical companies reported their OPEX success stories, learning from industry practices and company specific approaches turned into a valuable source for own improvements. Accordingly, the investigation of OPEX success factors became a focal point of the St.Gallen research since 2003. The St.Gallen Model for Operational Excellence, which was presented in the article The Link between Plant Performance & Maturity – Seeing the whole picture, has been continuously further developed. Based on that model, the Institute of Technology Management conducts international benchmarking projects to support pharmaceutical companies on their OPEX journey. This article will continue to present insights into the St.Gallen OPEX Benchmarking approach and will then look back on the last 15 years development of Pharmaceutical Operational Excellence from a St.Gallen perspective.
St.Gallen OPEX Benchmarking
Benchmarking can be considered as a practice to compare business concepts, processes and performance to successful practices. A benchmarking then provides necessary insights to identify areas of potential improvement. The St.Gallen OPEX Benchmarking, initiated in 2003, pursues that aim by helping pharmaceutical companies to locate themselves within their competitive landscape, creating meaningful comparisons and striving for sustainable improvements. In doing so, the Institute of Technology Management advances the industry in its endeavour towards OPEX and can, to this day, draw on the world’s largest independent pharmaceutical OPEX-database. Therefore, the database includes data from more than 400 pharmaceutical manufacturing sites from over 143 companies ranging from small- and medium sized companies to big pharma companies. Five years ago, the St.Gallen OPEX Benchmarking was revised to allow an even more targeted comparison among plants that manufacture different drug substances and products. Additionally, the latest update provides for the inclusion of a full operationalisation of the ICH Q10 pharmaceutical quality model.
In accordance to a holistic understanding of performance, the St.Gallen OPEX Benchmarking takes into consideration a balanced management of cost, quality, and time. It also comprises structural and behavioural aspects, which are necessary to support continuous improvement activities and it further addresses those elements that are directly linked to the field of management and the engagement of employees.
To systematically collect benchmarking data the St.Gallen OPEX model is operationalised in the St.Gallen OPEX questionnaire. Scientifically influenced by a system perspective, the questionnaire considers key performance indicators (KPIs), enablers (maturity) and structural factors together. That way KPIs are not going to be analysed without the consideration of implementation levels of specific approaches and tools, nor without understanding of the specific context of a plant. In total, the questionnaire asks for 36 KPIs in the technical system consisting of the three categories Total Productive Maintenance (TPM), Total Quality Management (TQM) and Justin-Time (JIT). Thereby, each category is operationlised to measure effectiveness and efficiency, e.g. TPM is not only measured with overall equipment effectiveness (TPM effectiveness) but also with the share of maintenance costs to conversion costs (TPM efficiency).Furthermore 12 KPIs are queried in the social sub system, to which can be referred to as Effective Management System (EMS). Besides taking performance metrics into account, the questionnaire also asks for enablers that are operationalised in five-point likert scales with distinct descriptions of each stage. Enablers, in this sense, measure the degree of implementation or proportion of usage of practices, eventually determining a sites OPEX maturity. Lastly, structural factors like product type, size or complexity are considered to ensure a holistic picture of the site’s current situation.
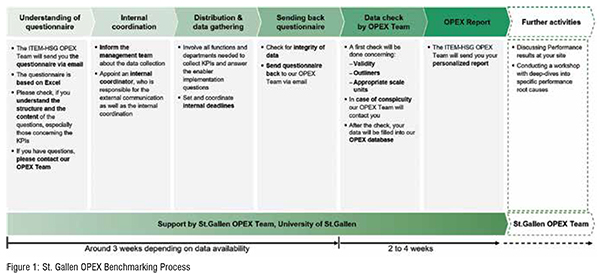
Due to the broad St.Gallen experience in the field of benchmarking, a standardised and efficient procedure is applied to each individual benchmarking project. In this procedure (cf. Figure 1), the benchmarking partner gathers the data while getting continuous support in dedicated Q&A sessions from the St.Gallen team. Once the completed questionnaire is sent back, the data will then be validated from the St.Gallen team to ensure data quality. The standardised benchmarking process then terminates with the generation of a personalised report. On the one hand, this report comprehensively illustrates the performance of the benchmarking partner compared to the technology peer group. On the other hand, the report reveals the implementation of enablers and shows the comparison to the industry. Figure 1.
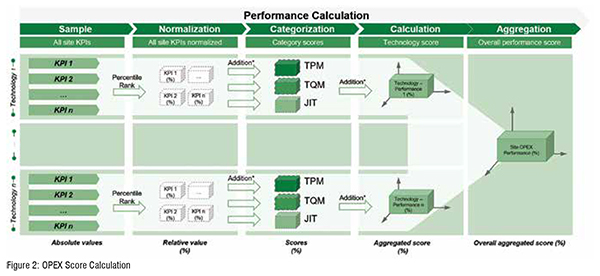
As a balanced approach for performance calculation the report also provides an overall OPEX score. This single, aggregated metric considers a variety of KPIs and makes the meaningful comparison of different sites possible in the first place. In order to calculate the overall OPEX score, several aggregation steps need to be made (Figure 2). First, KPIs are normalised to account for different logics and scales of metrics. That is, the best value within a sample of a certain metric equals 100 per cent, the worst value equals 0 per cent, and values in between receive a percentile rank accordingly. Secondly, the relative values for a specific set of KPIs are going to be aggregated for each category (TPM, TQM, JIT). The average of these category scores then defines the technology performance score (e.g., solids technology score). Lastly, if the site produces multiple technologies, the average of all technology scores defines the overall site OPEX performance score. Figure 2.
What differentiates the St.Gallen OPEX Benchmarking logic from other often consultancy benchmarking is the identification of and the comparison to high-performers. A typical consultancy benchmark demonstrates performance for each KPI against the highest values in the sample for this respective KPI. This however leads to an unrealistic benchmark perspective, in which the high-performer values of one KPI might stem from a totally different site than the high-performer values for another KPI. In other words, the consultancy benchmark compares a site always to the highest values even though this combination of high-performer values has never been achieved by a single site. This unrealistic combination of high-performer values is, therefore, called a “virtual best practice” site, which is actually composed of various sites. An analogy to the sports world is the decathlete who competes in every single discipline. The St.Gallen OPEX Benchmarking, however, provides a more realistic, trade-off aware comparison. Before comparing on a KPI level, the St.Gallen OPEX Benchmarking defines a high-performer peer group, which includes sites that achieve true excellence managing existing trade-offs between KPIs. The definition of high-performers is based on the above mentioned OPEX score, whereas the top 25 per cent performing sites make up the high-performer peer group. This peer group is kept unchanged while a benchmarking partner’s site is compared within each KPI to the highperformers value which is the average of the high-performer peer group. Hence, the decathlete is competing in a decathlon.
In order to deepen the understanding of the benchmarking results, the St.Gallen OPEX team provides the possibility to conduct a company specific tailored workshop. Main goal of that workshop is an open discussion around sharing of successful practices, identifying of improvement areas and deriving an improvement action plan.
In addition to the described St.Gallen OPEX Benchmarking, the Institute of Technology Management developed a second benchmarking, which is especially tailored to QC Labs. Providing more details on the St.Gallen approach for QC labs will be of main interest in our forthcoming article. Nevertheless, from our experience, combining both benchmarkings at one site allows to draw a more holistic picture of OPEX performance throughout the entire value chain of drug production.
Development of OPEX in Pharma in the last 15 years
Following the scientific discussion of OPEX, scholars like Clode (1993), Billesbach & Hayen (1994), De Menezes et al. (2010) or Yang et al. (2012) have already shown early that specific improvement concepts like JIT or TQM eventually lead to significant increases in performance. However they focused on achieving OPEX in other industries than the pharmaceutical industry.
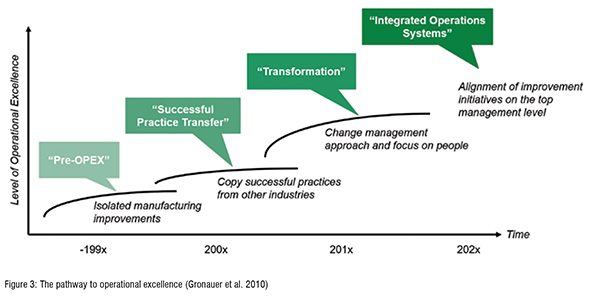
The development of OPEX in the pharmaceutical industry took place in three major phases (cf. Figure 3). Starting with a Pre-OPEX phase, which lasted until the late 1990s, no structured and carefully designed approaches to improve manufacturing processes were carried out. Furthermore, the underlying culture of ”no change” was predominant within the industry. With the second phase, the Best Practice Transfer phase, starting around the early 2000s, pharmaceutical production managers began to visit automotive plants like Toyota, BMW, Daimler etc. Their goal was to copy proven OPEX practices to the pharmaceutical production floor. Nevertheless, it became clear, that just copying practices was not sufficient to get the buy-in from employees. Therefore, the third phase, the Transformation-phase,in which we can find most of the advanced companies in today, focuses on people and change management. The last phase that is gradually emerging is the “Integrated Operations System” phase. That phase will, from our understanding, combine preventive and reactive OPEX and align all improvement initiatives on the top management level (Friedli & Werani, 2013). Figure 3.
From our benchmarking data, we also see that the implementation of OPEX practices for TPM, TQM and JIT has progressed over the last 15 years. On average the data show that the implementation of practices related to TQM is the highest, which might lead back to the point that some of the practices in TQM are related to the regulatory authorities and Good Manufacturing Practices (GMPs). As GMPs need to be followed to be compliant, the high overall implementation in this category does not come as a surprise. With respect to practices centred around equipment stability, respectively technology management (TPM), and flow (JIT) it can be seen that these two categories started at the same implementation level. However, the implementation level of TPM then evolved stronger, which can be aligned with literature proposing that TPM practices need to be implemented in the beginning of each OPEX program (cf. Ferdows & Thurnheer, 2011; Bortolotti et al., 2015). In addition to analysing isolated implementation levels of enablers, we especially looked at simultaneous implementation of enablers as literature suggests building capabilities integratively. Indeed, the data showed that there is a trend towards slight improvement of implementing enablers in a more integrative manner. A possible explanation is that manufacturing sites make an effort to implement practices simultaneously instead of piecemeal improvement. Another explanation could be that manufacturing sites are increasingly capable of closing gaps between enabler implementation levels after the implementation of certain practices has already taken place. Overall, we observe an increasing implementation degree of OPEX in the Pharma industry over the last 15 years (Eich et al., 2020).
Outlook
Due to an increasingly difficult environment combined with the support of regulatory agencies, Pharma companies have embarked on their OPEX journey. Since then the Institute of Technology Management has been supporting them in their OPEX activities by helping to position themselves in their competitive landscape and to identify improvement potentials with the St.Gallen OPEX Benchmarking approach. Overall, the benchmarking data shows that pharmaceutical manufacturing sites are adopting more and more OPEX practices and techniques. Especially practices related to quality show the highest levels of implementation, while improvements in maintenance and equipment show the strongest increase over time. Additionally, it can be seen that companies increasingly pay attention to social and cultural aspects in their OPEX activities. Our forthcoming article will present the St.Gallen QC Lab Benchmarking in more depth and will look at QC as part of the entire value chain. That way the holistic St.Gallen perspective towards benchmarking pharmaceutical companies will be extended.
Literature
Billesbach, T. J. and Hayen, R. (1994). "Long-term impact of just-in-time on inventory performance measures". Production and Inventory Management Journal, 35(1), pp. 62–67.
Bortolotti, T., Boscari, S., Danese, P. (2015). "Successful lean implementation: Organizational culture and soft lean practices". Int. J. Production Economics, 160 (2015), pp. 182-201.
Clode, D. M. (1993). "Survey of U.K. manufacturing control over the past ten years". Production and Inventory Management Journal, 34(2), pp. 53–56.
De Menezes, L. M., Wood, S. and Gelade, G. (2010). "The integration of human resource and operation management practices and its link with performance: A longitudinal latent class study". Journal of Operations Management, 28(6), pp. 455–471. doi: 10.1016/j. jom.2010.01.002.
Eich, S., Grothkopp, M., Macuvele, J., Friedli, T. (2020). "Progress of Operational Excellence implementation and performance in pharmaceutical manufacturing sites – descriptive study from 2003 to 2018”. 27th EurOMA conference 29th - 30th June 2020, University of Warwick (UK).
Ferdows, K., & Thurnheer, F. (2011). " Building factory fitness". International Journal of Operations & Production Management, 31(9) pp. 916-934. https://doi.org/10.1108/01443571111165820.
Friedli, T. & Werani, J. (2013). "The History of OPEX in the Pharmaceutical Industry". In: Friedli, T., Basu, P., Bellm, D., & Werani, J. Leading Pharmaceutical Operational Excellence: Outstanding Practices and Cases. Berlin: Springer; 2013. pp. 27-34.
Friedli, T., Lembke, N., Schneider, U., Gütter, S. (2013). "The Current State of Operational Excellence Implementation: 10 Years of Benchmarking". In: Friedli, T., Basu, P., Bellm, D., & Werani, J. Leading Pharmaceutical Operational Excellence: Outstanding Practices and Cases. Berlin: Springer; 2013. pp. 35-58.
Gronauer, T., Friedli, T.,Götzfried, M. (2010). "The roadmap to operational excellence – pattern and elements of OPEX programs". In: Friedli et al. (2010) The pathway to operational excellence – overcoming the internal inertia. Editio Cantor Verlag, Aulendorf.
Yang, C.-C., Yeh, T.-M. and Yang, K.-J. (2012). "The implementation of technical practices and human factors of the toyota production system in different industries", Human Factors and Ergonomics in Manufacturing & Service Industries, 22(6), pp. 541–555. doi: 10.1002/hfm.20296.
Author Bio

Mark Grothkopp is a research associate at the University of St.Gallen. At the Institute of Technology Management, he coordinates the Operational Excellence team with a special focus on the pharmaceutical industry. Currently, his academic research focuses on production systems evolutions.

Lorenzo Pirrone is a research associate at the University of St.Gallen. At the Institute of Technology Management, he works in the Operational Excellence team with a special focus on the pharmaceutical industry. His research focus lies in the field of maturity development and performance measurement.

Thomas Friedli is a director at the Institute of Technology Management. He leads a division of 14 PhD students and two post-docs. His research areas include strategic management of production companies, management of industrial services, and operational excellence. He is editor, author and coauthor of numerous books and articles.


